Figure 6.
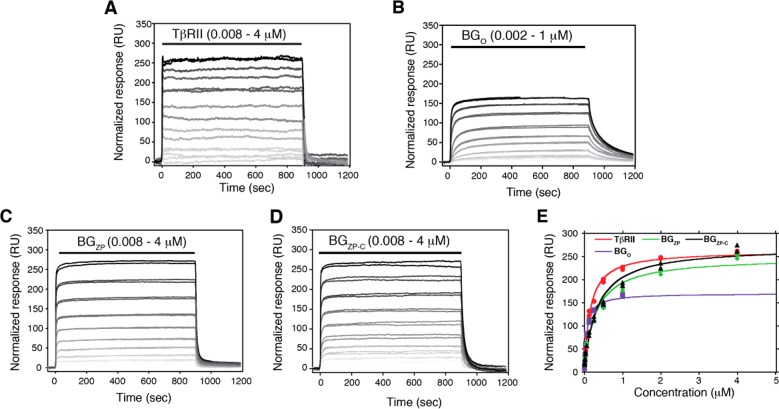
Binding of TβRII, BGO, BGZP, and BGZP-C to TGF-β2TM and estimation of their binding stoichiometries. (A–D) SPR sensorgrams for binding of TβRII, BGO, BGZP, and BGZP-C, respectively, to immobilized TGF-β2TM. Black lines over sensorgrams denote the period of injection of a 2-fold dilution series (from 4 to 0.008 μM for TβRII, BGZP, and BGZP-C and from 1 to 0.008 μM for BGO). SPR data for TβRII, BGO, BGZP, and BGZP-C were all collected on the same SPR sensor chip; normalized responses were calculated by dividing the measured response by the molecular weight of the analyte in daltons and multiplying by 106. (E) Plot of the normalized equilibrium response for binding of TβRII, BGO, BGZP, and BGZP-C to TGF-β2TM as a function of their concentration. Equilibrium binding constants were obtained by fitting the normalized equilibrium response as a function of concentration to a standard binding isotherm (fitted curve shown as a solid line, red for TβRII, purple for BGO, greeen for BGZP, and black for BGZP-C).

