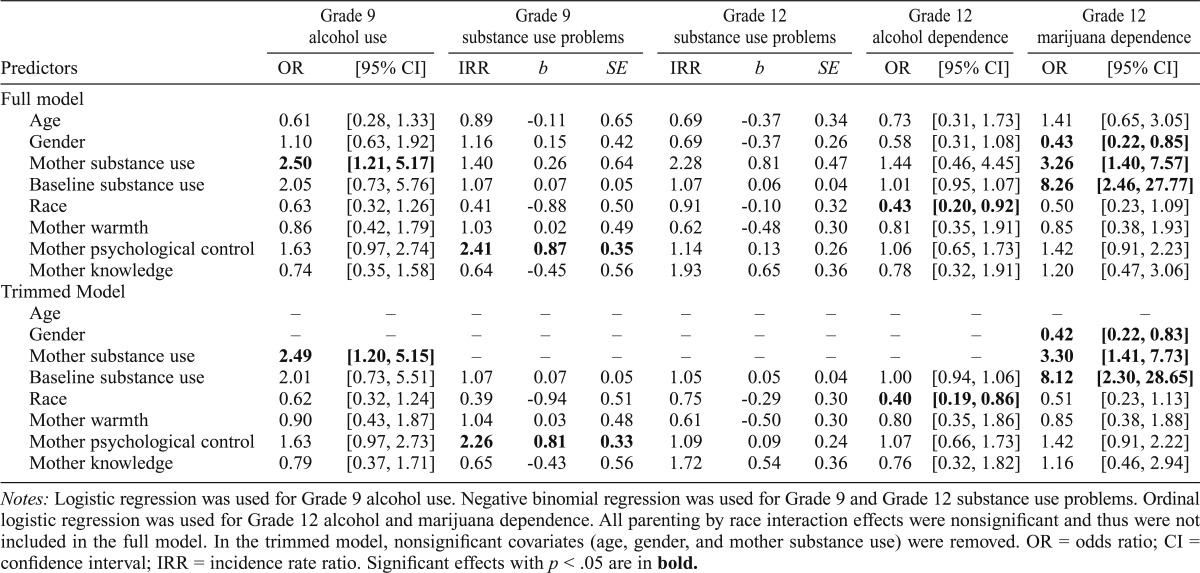
Table 3.
Direct effects of mother parenting on substance use outcomes
| Grade 9 alcohol use |
Grade 9 substance use problems |
Grade 12 substance use problems |
Grade 12 alcohol dependence |
Grade 12 marijuana dependence |
||||||||
| Predictors | OR | [95% CI] | IRR | b | SE | IRR | b | SE | OR | [95% CI] | OR | [95% CI] |
| Full model | ||||||||||||
| Age | 0.61 | [0.28, 1.33] | 0.89 | -0.11 | 0.65 | 0.69 | -0.37 | 0.34 | 0.73 | [0.31, 1.73] | 1.41 | [0.65, 3.05] |
| Gender | 1.10 | [0.63, 1.92] | 1.16 | 0.15 | 0.42 | 0.69 | -0.37 | 0.26 | 0.58 | [0.31, 1.08] | 0.43 | [0.22, 0.85] |
| Mother substance use | 2.50 | [1.21, 5.17] | 1.40 | 0.26 | 0.64 | 2.28 | 0.81 | 0.47 | 1.44 | [0.46, 4.45] | 3.26 | [1.40, 7.57] |
| Baseline substance use | 2.05 | [0.73, 5.76] | 1.07 | 0.07 | 0.05 | 1.07 | 0.06 | 0.04 | 1.01 | [0.95, 1.07] | 8.26 | [2.46, 27.77] |
| Race | 0.63 | [0.32, 1.26] | 0.41 | -0.88 | 0.50 | 0.91 | -0.10 | 0.32 | 0.43 | [0.20, 0.92] | 0.50 | [0.23, 1.09] |
| Mother warmth | 0.86 | [0.42, 1.79] | 1.03 | 0.02 | 0.49 | 0.62 | -0.48 | 0.30 | 0.81 | [0.35, 1.91] | 0.85 | [0.38, 1.93] |
| Mother psychological control | 1.63 | [0.97, 2.74] | 2.41 | 0.87 | 0.35 | 1.14 | 0.13 | 0.26 | 1.06 | [0.65, 1.73] | 1.42 | [0.91, 2.23] |
| Mother knowledge | 0.74 | [0.35, 1.58] | 0.64 | -0.45 | 0.56 | 1.93 | 0.65 | 0.36 | 0.78 | [0.32, 1.91] | 1.20 | [0.47, 3.06] |
| Trimmed Model | ||||||||||||
| Age | – | – | – | – | – | – | – | – | – | – | – | – |
| Gender | – | – | – | – | – | – | – | – | – | – | 0.42 | [0.22, 0.83] |
| Mother substance use | 2.49 | [1.20, 5.15] | – | – | – | – | – | – | – | – | 3.30 | [1.41, 7.73] |
| Baseline substance use | 2.01 | [0.73, 5.51] | 1.07 | 0.07 | 0.05 | 1.05 | 0.05 | 0.04 | 1.00 | [0.94, 1.06] | 8.12 | [2.30, 28.65] |
| Race | 0.62 | [0.32, 1.24] | 0.39 | -0.94 | 0.51 | 0.75 | -0.29 | 0.30 | 0.40 | [0.19, 0.86] | 0.51 | [0.23, 1.13] |
| Mother warmth | 0.90 | [0.43, 1.87] | 1.04 | 0.03 | 0.48 | 0.61 | -0.50 | 0.30 | 0.80 | [0.35, 1.86] | 0.85 | [0.38, 1.88] |
| Mother psychological control | 1.63 | [0.97, 2.73] | 2.26 | 0.81 | 0.33 | 1.09 | 0.09 | 0.24 | 1.07 | [0.66, 1.73] | 1.42 | [0.91, 2.22] |
| Mother knowledge | 0.79 | [0.37, 1.71] | 0.65 | -0.43 | 0.56 | 1.72 | 0.54 | 0.36 | 0.76 | [0.32, 1.82] | 1.16 | [0.46, 2.94] |
Notes: Logistic regression was used for Grade 9 alcohol use. Negative binomial regression wasused for Grade 9 and Grade 12 substance use problems. Ordinal logistic regression was used for Grade 12 alcohol and marijuana dependence. All parenting by race interaction effects were nonsignificant and thus were not included in the full model. In the trimmed model, nonsignificant covariates (age, gender, and mother substance use) were removed. OR = odds ratio; CI = confidence interval; IRR = incidence rate ratio. Significant effects with p < .05 are in bold.

