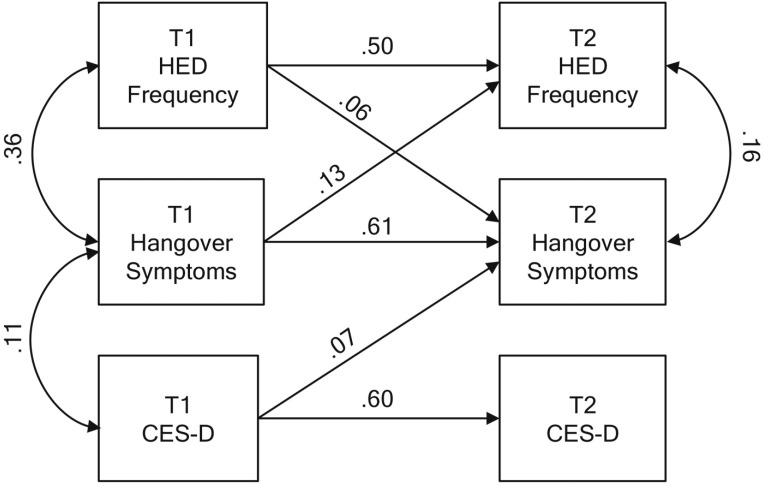
Figure 1.
Main results from the final trimmed cross-lagged panel model. Numerical estimates represent standardized path coefficients. All depicted path coefficients were statistically significant. To simplify presentation, paths from covariates (sex and smoking) are omitted from the diagram. T1 = Time 1; T2 = Time 2; HED = heavy episodic drinking; CES-D = Center for Epidemiologic Studies Depression Scale.

