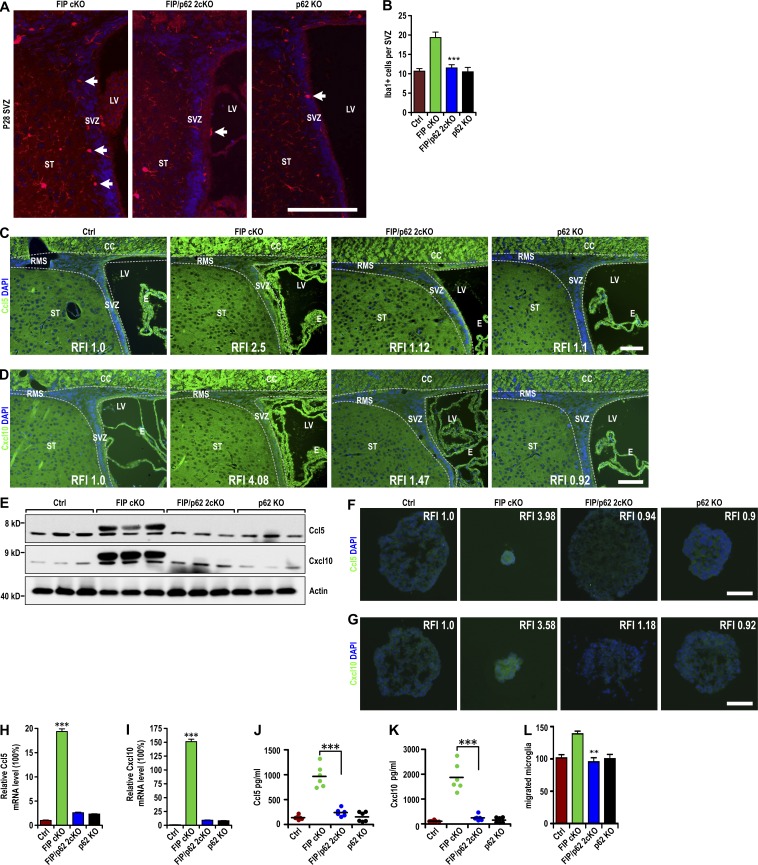
Figure 6.
Accumulated p62-mediated increase in Ccl5 and Cxcl10 expression and microglia infiltration in the FIP200-deficient SVZ. (A) Immunofluorescence of Iba1 and DAPI in the SVZ (three mice each) of FIP cKO, FIP/p62 2cKO and p62 KO mice at P28. Arrows indicate Iba1+ microglia. (B) Number of Iba1+ microglia per SVZ section in Ctrl, FIP cKO, FIP/p62 2cKO, and p62 KO mice at P28 (mean ± SEM; six mice each). (C and D) Immunofluorescence of Ccl5 (C) and Cxcl10 (D) with DAPI in the SVZ (three mice each) of Ctrl, FIP cKO, FIP/p62 2cKO, and p62 KO mice at P28. Dotted lines indicate the boundaries of SVZ. (E) Lysates were extracted from the SVZ of Ctrl, FIP cKO, FIP/p62 2cKO, and p62 KO mice at P28 and analyzed by immunoblot using antibodies to detect Ccl5, Cxcl10, and actin (three mice each). (F and G) Immunofluorescence of Ccl5 (F) and Cxcl10 (G) with DAPI in neurospheres from Ctrl, FIP cKO, FIP/p62 2cKO, and p62 KO mice at P28 (three mice each). (H and I) mRNA levels of Ccl5 (H) and Cxcl10 (I) in neurospheres from Ctrl, FIP cKO, FIP/p62 2cKO, and p62 KO mice (mean ± SEM; four mice each). (J and K) Concentration of Ccl5 (J) and Cxcl10 (K) in conditioned medium of neurospheres (normalized to 1 mg of total protein lysate of neurospheres) from Ctrl, FIP cKO, FIP/p62 2cKO, and p62 KO mice are shown (mean ± SEM; six mice each). (L) Number of migrated microglia in conditioned media from neurospheres of Ctrl, FIP cKO, FIP/p62 2cKO, and p62 KO mice as attractant (mean ± SEM; four mice each). CC, corpus callosum; E, ependymal layer; LV, lateral ventricle; RFI, relative fluorescence intensity; RMS, rostral migratory stream; ST, striatum; SVZ, subventricular zone. Bars: (A) 40 µm; (C and D) 30 µm; (F and G) 20 µm. **, P < 0.01; ***, P < 0.001.

