Figure 6.
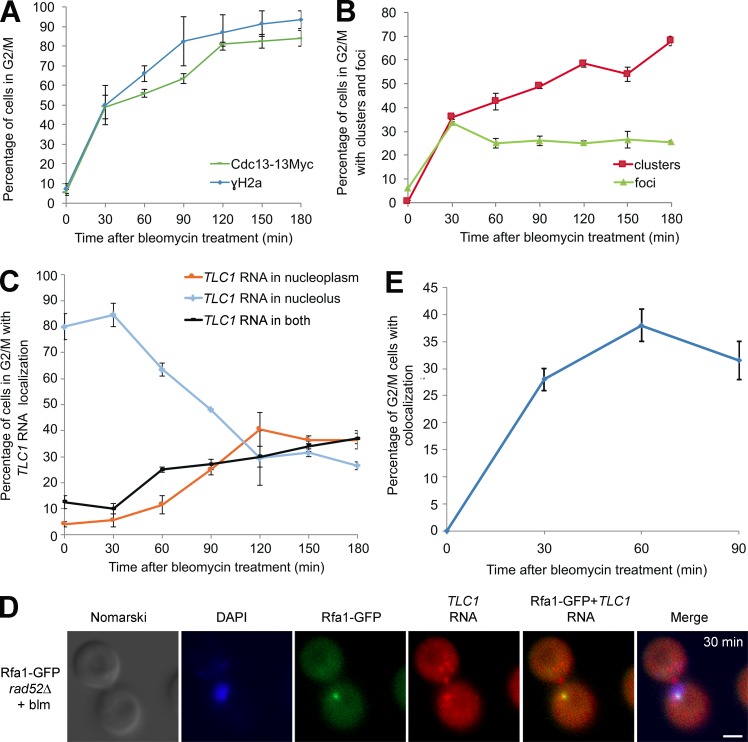
Kinetics of accumulation of Cdc13 and TLC1 RNA at sites of DNA damage inrad52Δ cells. (A) Kinetics of γ-H2A and Cdc13 foci formation in G2/M cells after exposure to bleomycin. (B) Time course of Cdc13 foci and cluster formation in G2/M cells after exposure to bleomycin. (C) Kinetics of TLC1 RNA nucleoplasmic accumulation in G2/M cells after exposure to bleomycin. (D) Colocalization between TLC1 RNA focus and Rfa1-GFP focus in G2/M cells after 30 min of bleomycin exposure. Bar, 1 µm. (E) Kinetics of colocalization between a TLC1 RNA focus and a Rfa1-GFP focus in G2/M cells after exposure to bleomycin; n = 200 cells per time point. Error bars represent ±SD.

