Figure 2.
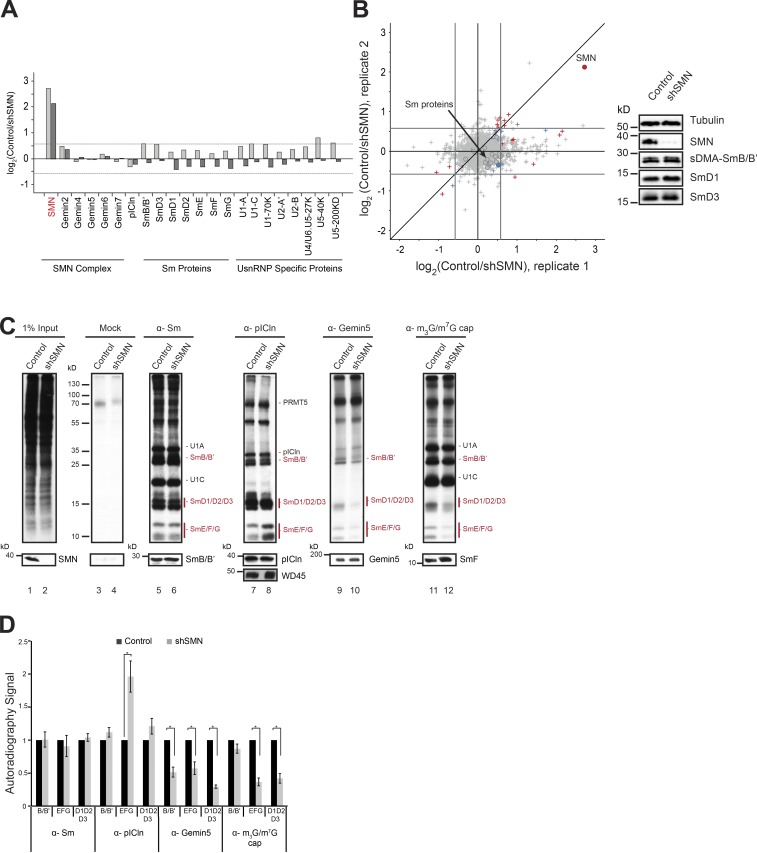
Knockdown of SMN causes Sm protein tailback on pICln. (A) Bar graphs representing normalized log2 fold change in expression (control/shSMN) of UsnRNP-related proteins as well as those of SMN complex and pICln (circles in scatter plot; B) in pSILAC experiments. Dark- and light-gray bars represent two independent replicates. (B) Normalized values of fold change in protein expression during SMN depletion, from two independent pSILAC experiments. Circles indicate proteins involved in UsnRNP pathway that are listed in the bar graph in A. Arrow in the top right quadrant indicates SMN; arrow in the center indicates Sm proteins (gray area). Red, blue, and gray colors indicate high, moderate, or insignificant changes in expression, respectively. (Right) Western blot showing steady-state levels of Sm proteins (sDMA SmB/B', D1, D3) in control and shSMN samples. (C) [35S]methionine metabolic labeling and immunoprecipitation (IP) using antibodies against symmetrically dimethylated Sm proteins, pICln, Gemin5, and m3G/m7G-cap. (Top) Autoradiography of immunoprecipitated samples from control and SMN knockdown cells. (Bottom) Corresponding Western blot controls for immunoprecipitation with molecular weight (in kD) from the marker indicated on the left of the image. (D) Quantification of the autoradiography image shown in C, from three independent biological experiments for Sm, Gemin5, and m3G/m7G-cap IPs and five independent biological experiments for pICln IP. Black and gray bars represent control and SMN knockdown conditions, respectively. Error bars represent standard error (SE); *, P < 0.05 calculated using Student’s t test.

