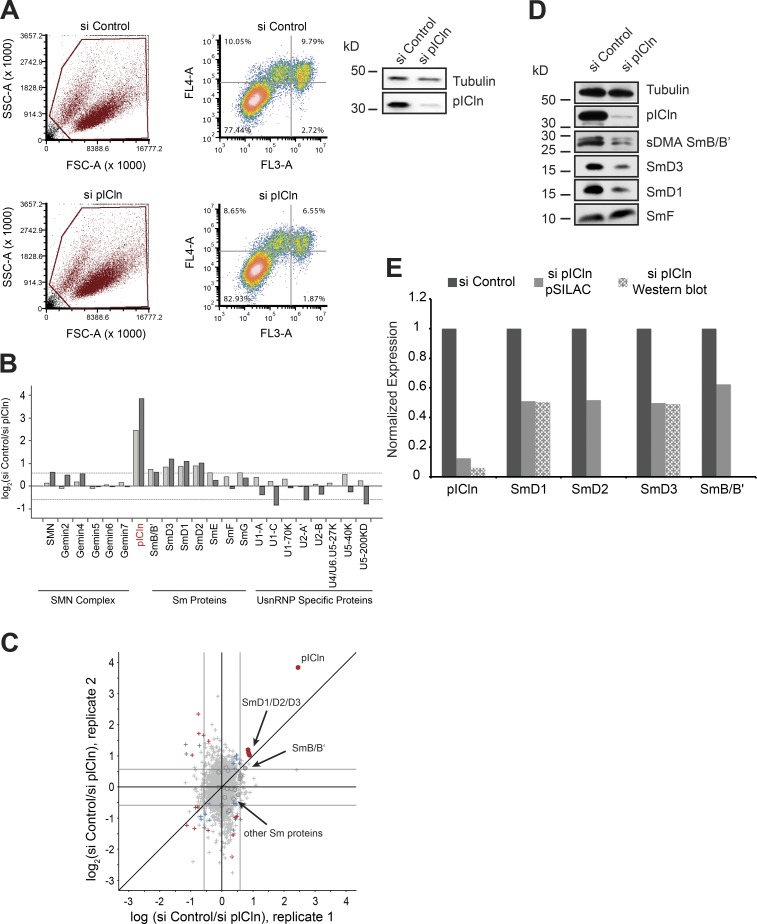
Figure 4.
Sm proteins are down-regulated in the absence of the pICln. (A) FACS analysis of control (top) and pICln knockdown cells (bottom) 120 h after siRNA transfection, after staining with annexin V (FL4-A channel) and propidium iodide (FL3-A channel). (Left) Gating of all cells (brown); right, distribution of necrotic (bottom right quadrant), early apoptotic (top right quadrant), and apoptotic (top left quadrant) cells along with the respective quantification. (Right) Western blot using antibodies specific to pICln to validate knockdown in cells used for FACS analysis, with tubulin as loading control. (B) Bar graphs representing normalized log2 fold change in expression of UsnRNP-related proteins and proteins of the SMN complex compared between control siRNA and sipICln cells during pSILAC experiment. Dark- and light-gray bars represent replicates 1 and 2, respectively. (C) Normalized values of fold change in protein expression during pICln depletion from two independent pSILAC experiments. Circles indicate proteins involved in UsnRNP pathway that are listed in the bar graph in B. Red dots in the top right quadrant indicate pICln and SmD1/D2/D3; arrow in the center indicates the other Sm proteins (gray area). Red, blue, and gray colors indicate high, moderate, or insignificant changes in expression, respectively. (D) Western blot analysis of soluble cell lysates prepared for pSILAC, from control and pICln knockdown cells, using anti-pICln, anti–sDMA-Sm (Y12), anti-SmD3, anti-SmD1, and anti-SmF antibodies, respectively. Anti-tubulin antibody was used to monitor sample loading. (E) Quantification of the Western blot images shown in D and pSILAC shown in B and C, from two independent biological replicates. Black, gray, and checkered gray bars indicate control, pSILAC, and Western blot quantifications, respectively.

