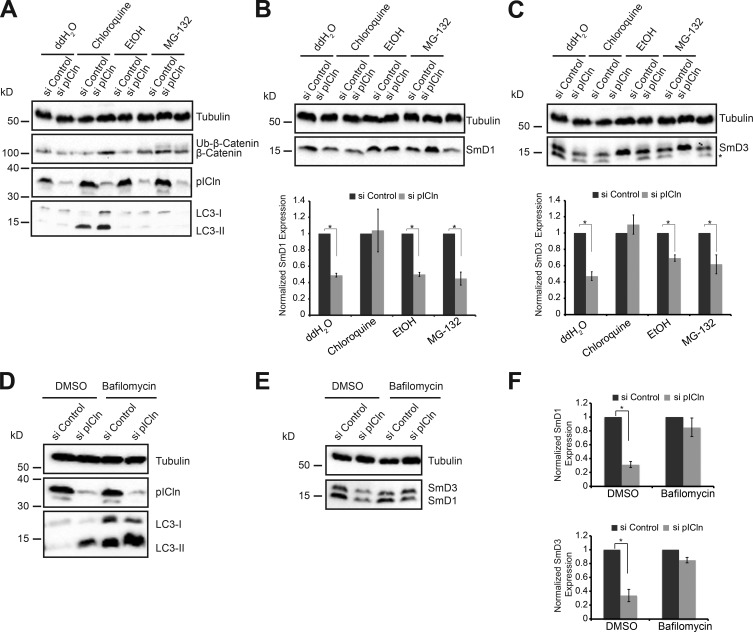
Figure 6.
Sm proteins are degraded by autophagy upon pICln knockdown. (A) Western blot analysis of total cell lysates using antibodies against pICln (knockdown control), β-catenin (control for proteasome inhibition using MG-132), and LC3-II (control for autophagy inhibition using chloroquine). Anti-tubulin antibodies were used to monitor equal loading of all samples. (B and C, top) Western blot analysis of SmD1 (B) and SmD3 (C) using anti-tubulin antibodies to monitor equal loading, in control and pICln knockdown cells upon treatment with water (ddH2O), ethanol (EtOH)), chloroquine, or MG-132. (Bottom) Quantification of the Western blot from three independent biological experiments (n = 3). Error bars represent SE; *, P < 0.05. Black and gray bars represent control and pICln knockdown conditions, respectively. (D) Western blot analysis of total cell lysates using antibodies against LC3-II (control for autophagy inhibition using bafilomycin A) and pICln, with tubulin as loading control, in control and pICln knockdown conditions. (E) Western blot analysis of total cell lysates using antibodies against SmD1 and D3, with tubulin as loading control, in control and pICln knockdown conditions, upon bafilomycin A treatment, with DMSO as solvent control. (F) Quantification of the Western blot shown in E, from independent biological triplicates (n = 3). Error bars represent SE; *, P < 0.05. Black and gray bars represent control and pICln knockdown conditions, respectively.

