Figure 4.
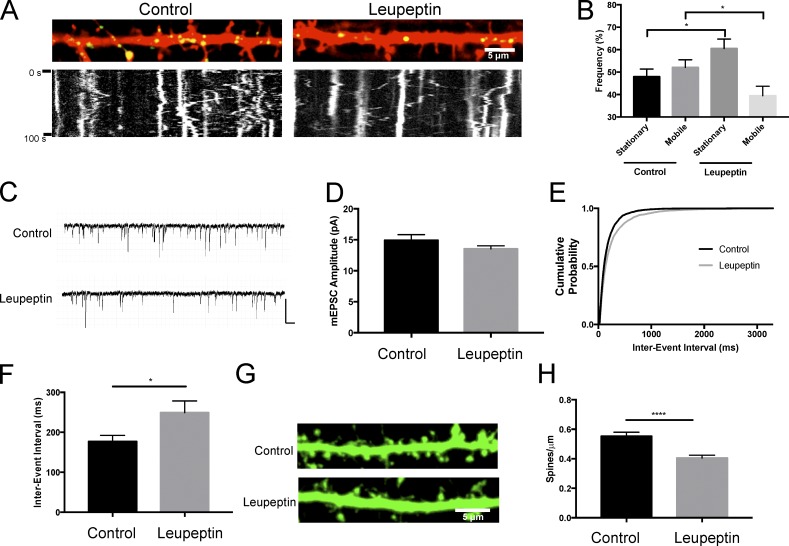
Lysosomal inhibition alters lysosome trafficking and decreases dendritic spine density. (A) Lysosomal inhibition decreases lysosome trafficking in hippocampal dendrites. Representative live images of secondary dendrites from cultured hippocampal neurons (DIV16) transfected with mCherry and LAMP1-GFP with the corresponding kymograph below. Cultures were treated with 200 µM leupeptin for 3 h. Images represent the first image in the time-lapse sequence. Live images were taken every second for 100 s. Vertical lines in kymographs represent stationary structures. (B) Quantification of LAMP1-GFP movement in dendrites from kymographs represented in A. Movement was manually counted in a blinded fashion. 306 (control) and 245 (leupeptin) vesicles from n = 23 and 19 dendrites for control and leupeptin, respectively. *, P < 0.05 between stationary groups; *, P < 0.05 between mobile, unpaired Student’s t test. Data represent mean ± SEM. Experimenter was blinded to condition upon analysis. (C–F) Lysosomal inhibition decreases mEPSC frequency and dendritic spine density. (C) Representative traces of mEPSCs recorded from control and 200 µM leupeptin (2–4 h)–treated cultured hippocampal neurons (DIV 18–24); n = 25 and 31 cells for control and leupeptin, respectively; mean mEPSC amplitude (D); cumulative probability distribution of interevent interval (IEI) of all mEPSCs record from control and leupeptin-treated neurons n = 3679 and 4552 events, respectively (E); inter-event interval (*, P < 0.05 unpaired Student’s t test). (F). Data represent mean ± SEM. Bars: 200 ms; (traces) 20 pA. Experimenter was blinded to condition upon analysis. (G) Representative straightened dendrites after control and 200 µM leupeptin (3 h)–treated cultured hippocampal neurons (DIV15 to DIV16) expressing GFP via Sindbis viral transduction (16 h). (H) Quantification of spine density from conditions displayed in G. ****, P < 0.0001 unpaired Student’s t test. Data represent mean ± SEM with ≥49 dendrites quantified per treatment. Experimenter was blinded to condition upon analysis.

