Figure 5.
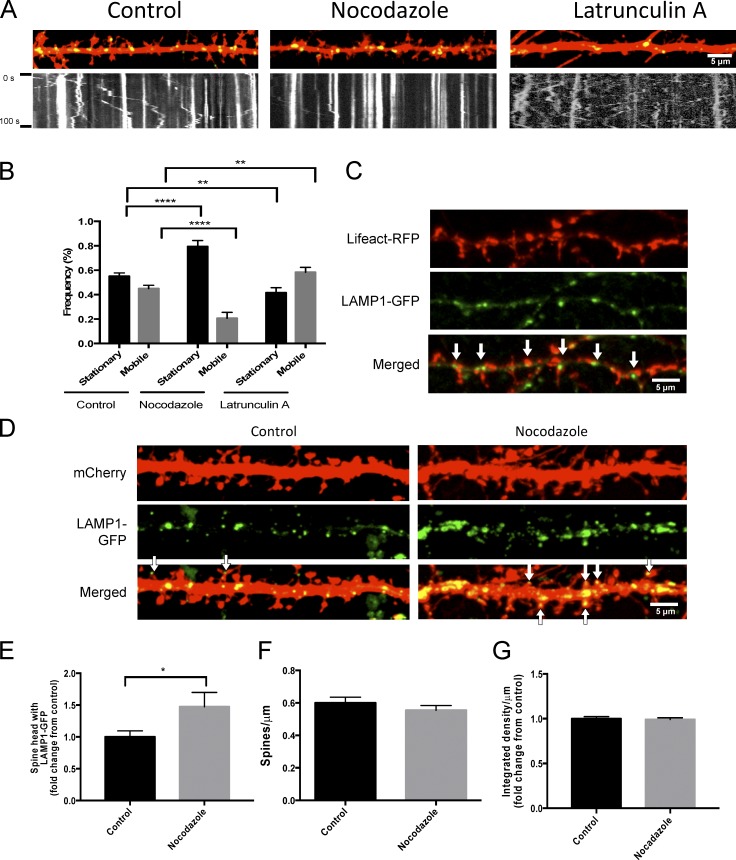
Perturbations in microtubule and actin dynamics alter trafficking of lysosome. (A and B) Disruption of microtubule and actin dynamics inversely affects lysosome trafficking. (A) Representative images of cultured neurons under control conditions, after treatment with 10 µg/ml nocodazole (1 h) or 20 µM latrunculin A (10 min) with respective kymographs. Straightened dendrites represent the first image in the time-lapse sequence. Live images were taken every second for 100 s. (B) Quantification of LAMP1-GFP movement after nocodazole or latrunculin A treatment from Fig. 4 A. Approximately 435 vesicles from 36, 15, and 24 dendrites in control, nocodazole-, and latrunculin A–treated cells, respectively, were analyzed from four independent experiments. ****, P < 0.0001; **, P < 0.01, unpaired Student’s t test. Data represent mean ± SEM. Experimenter was blinded to condition upon analysis. (C) Representative images of dissociated hippocampal cell expressing LAMP1-GFP and Lifeact-RFP. Arrows point to LAMP1-GFP juxtaposed to Lifeact-RFP. (D–G) Disruption of microtubule dynamics with nocodazole increases lysosomes in dendritic spines. (D) Representative image of a secondary dendrite from a cultured hippocampal neuron (DIV16) transfected with mCherry and LAMP1-GFP under control or 10 µg/ml nocodazole treatment (1 h). Arrows point to LAMP1-GFP in a dendritic spine. (E–G) Quantification of the percentage of spines that have LAMP1-GFP in the head of a spine (E). Number of spines per micrometer (F) and signal intensity of LAMP1-GFP (G) showed no significant difference between treatments. 690 and 512 spines for nocodazole from >25 dendrites for control and nocodazole treated cells, respectively, were analyzed from two independent experiments. *, P < 0.05, unpaired Student’s t test. Data represent mean ± SEM. Experimenter was blinded to condition upon analysis.

