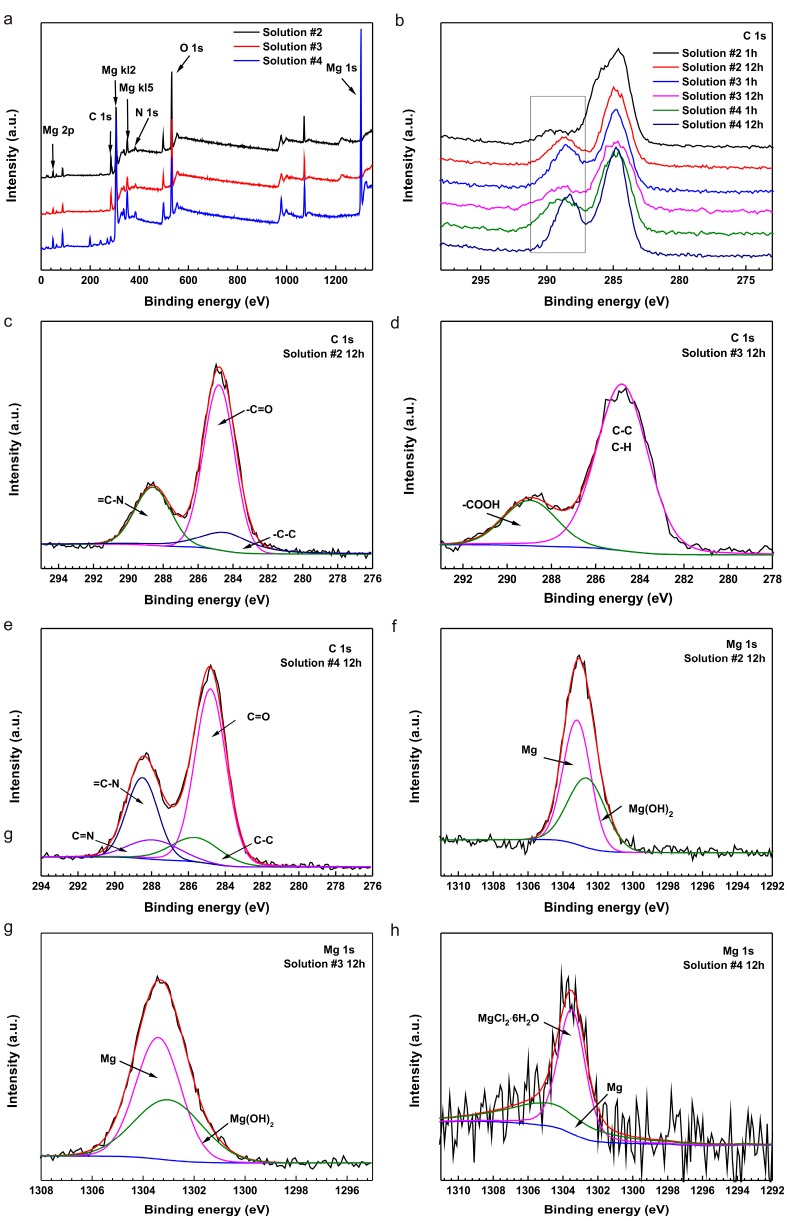
Figure 6.
X-ray photoelectron spectroscopy (XPS) analysis of a pure Mg surface after immersion in solution #2 through #4 for various periods showing the (a) entire range of the binding energy survey and (b) C 1s spectra for sample surfaces after immersion in solution #2 to #4 for 1 h and 12 h; C 1s spectra of samples immersed in (c) solution #2, (d) solution #3 and (e) solution #4 for 12 h; Mg 1s spectra for samples after immersion (f–h) in solution #2 to #4 for 12 h.

