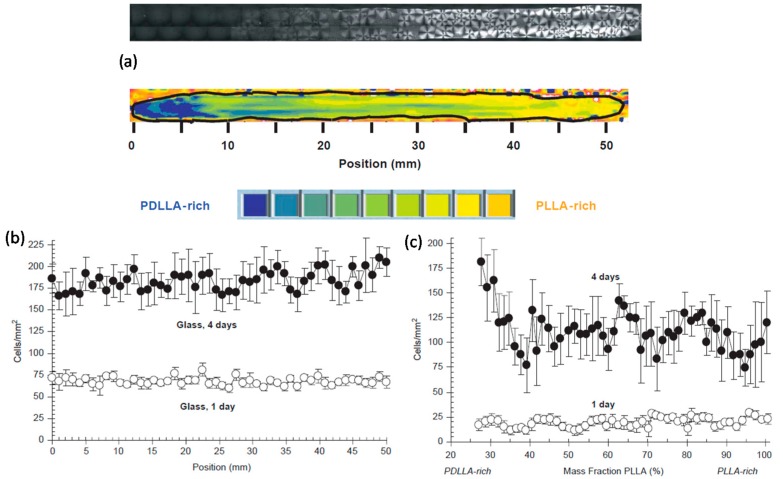
Figure 6.
(a) Top: An image of the birefringence from a PLLA-PDLLA gradient is shown. The higher crystallinity of the PLLA-rich end of the gradient causes it to be more birefringent than the PDLLA-rich end. The gradient shown is 52 mm long. Bottom: FTIR-reflectance-transmission microspectroscopy (RTM) map of a PLLA-PDLLA composition gradient. The strip film has been outlined with a black line. Blue corresponds to PDLLA rich regions and orange to PLLA-rich regions (see color bar below map); (b) Cell adhesion and proliferation on the PLLA-PDLLA gradients and on control glass slides. Adhesion data for 1 day and for proliferation data for 4 days are plotted; (c) Same data as b on the PLLA-PDLLA gradient substrate [58].

