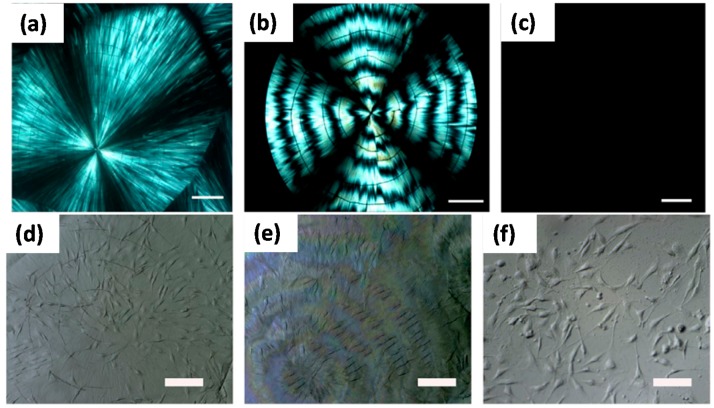
Figure 8.
Polarized optical images of PLLA films crystallized at various crystallization temperature (Tc) values. (a) Tc = 150 °C; normal spherulite surface (b) Tc = 145 °C; ring-banded spherulite (c) melt-quenched sample; amorphous surface. The scale bar represents 100 μm. Stereo microscope images of MC3T3-E1 cells cultured on PLLA surfaces; (d) normal spherulite surface; (e) ring-banded spherulite surface; (f) amorphous surface. The scale bar represents 100 μm [60].

