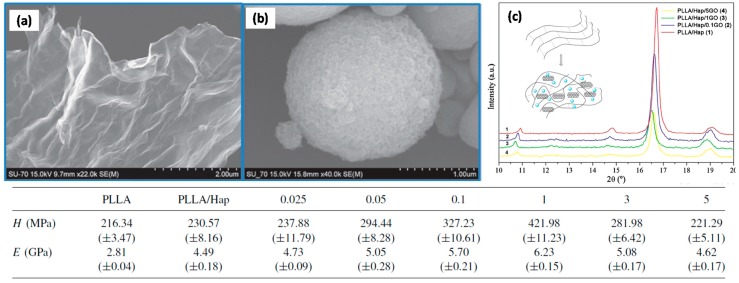
Figure 18.
SEM images of (a) graphene oxide and (b) hydroxyapatide; (c) X-ray diffraction patterns of PLLA/Hap and PLLA/Hap with 0.1, 1, and 5% of GO. Inset: schematic representation of polymer chains with and without Hap and GO fillers. The table shows hardness and elastic modulus values of PLLA, PLLA/Hap, and PLLA/Hap with different GO percentages, measured by nano-indentation [76].

