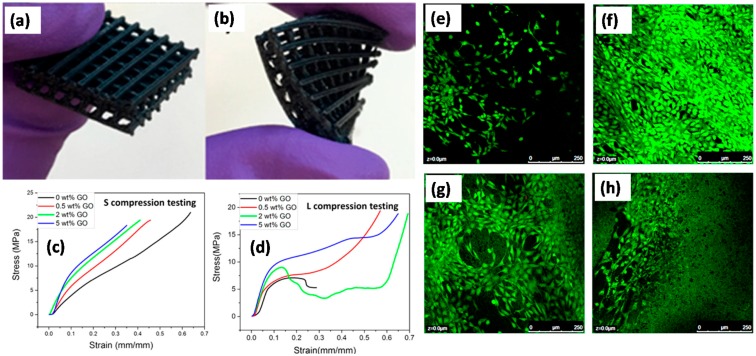
Figure 24.
(a) 3D printed microlattice (5 wt% of GO); (b) 3D printed microlattice under bending (5 wt% of GO); (c) S Compression testing curves of samples of different GO loadings; (d) L Compression testing curves of samples of different GO loadings. 96 h cell culture results of NIH3T3 cells on 3D printed TPU/PLA with different GO loadings: (e) 0 wt% GO; (f) 0.5 wt% GO; (g) 2 wt% GO; (h) 5 wt% GO. Green color indicates live cells, whereas red color indicates dead cell [83].

