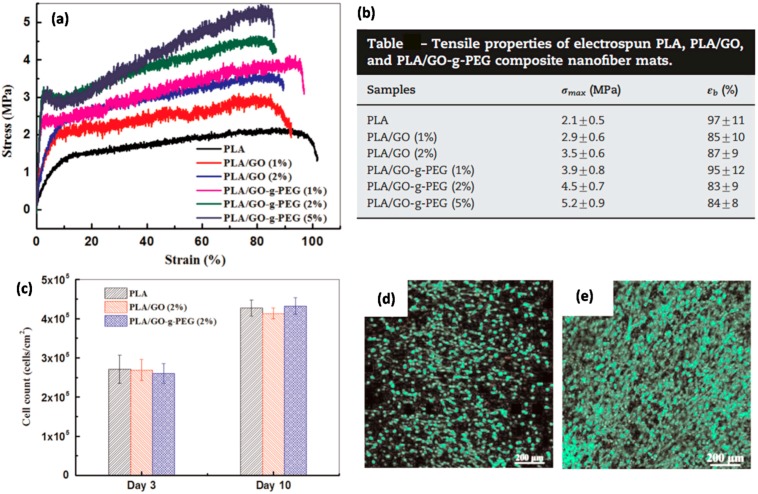
Figure 27.
(a) Typical stress–strain curves of electrospun PLA, PLA/GO, and PLA/GO-g-PEG composite nanofiber mats; (b) Table demonstrating elastic modulus (σmax) and elongation at break values (εb); (c) Proliferation cell counts of NIH 3T3 cells on scaffolds after 3 and 10 days of culture. Fluorescence micrographs of stained cells showing live (green) and dead (red) cells on PLA/GO-g-PEG (2%) scaffolds after (d) 3 and (e) 10 days of culture [86].

