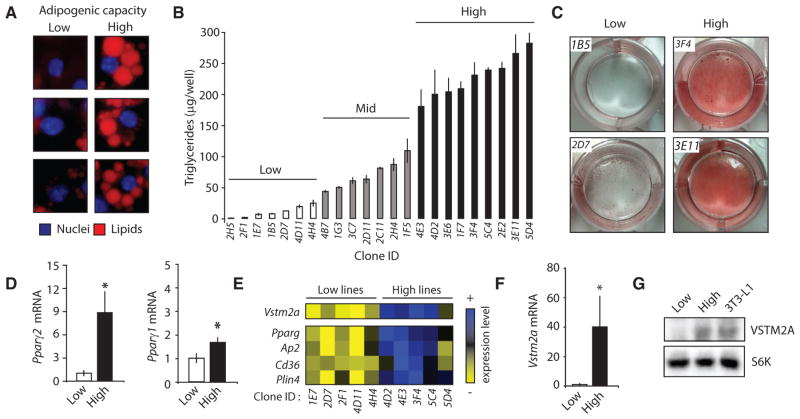
Figure 1. Identification of VSTM2A as a Gene Highly Expressed in Committed Preadipocytes.
(A) Examples of 3T3-L1 showing either low or high adipogenic capacity. Cells were stained with DAPI (blue) and LipidTox red (red) to stain the nuclei and the lipid droplets, respectively. Pictures of cells were taken from the same well 8 days following the induction of adipogenic differentiation.
(B) Triglyceride accumulation measured in 23 clonal lines of 3T3-L1 following the induction of differentiation. Lipid content was measured per well (n = 3/cell line) 8 days after the induction of differentiation. Data are presented as mean ± SEM. The difference between the low and high lines was confirmed in another independent experiment.
(C) Oil red O staining of low and high lines 8 days following the induction of differentiation. These pictures were produced from a single experiment.
(D) qRT-PCR analyses of Pparg2 and Pparg1 mRNA in subconfluent low (n = 7) and high (n = 8) cell lines. Data are presented as mean ± SEM and are representative of two independent experiments. *p < 0.05 versus low lines.
(E) Heatmap showing the differential expression profile of several genes between low (n = 5) versus high (n = 5) lines measured by microarray. These data are from a single experiment.
(F) qRT-PCR analyses of Vstm2a mRNA expression in subconfluent low (n = 7) and high (n = 8) cell lines. Data are presented as mean ± SEM and are representative of two independent experiments. *p < 0.05 versus low lines.
(G) Western blot analysis of VSTM2A protein levels in low, high, and parental 3T3-L1 cells. S6K was used as a loading control. These images are representative of at least three independent experiments.

