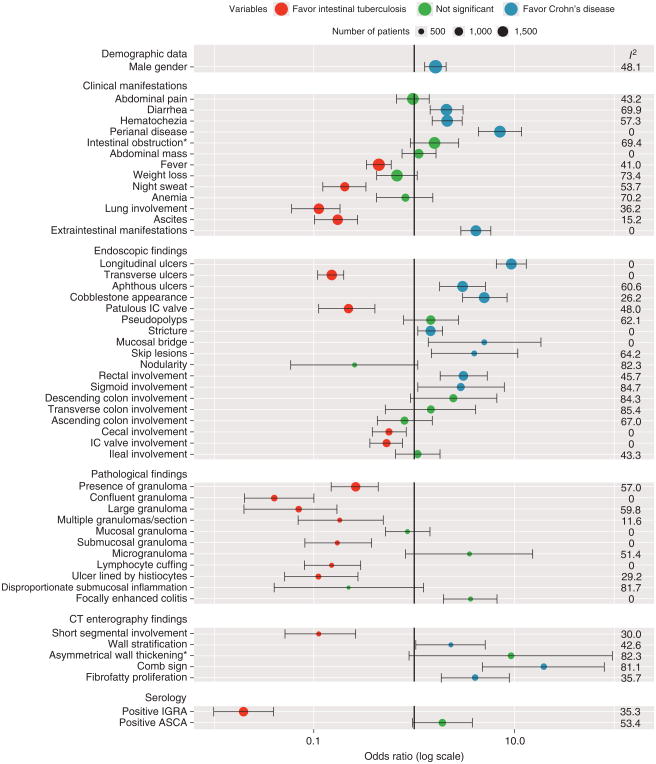
Figure 2.
Forest plot presenting odds ratios, 95% confidence intervals, and I2 of all predictor variables. “Clinical manifestation of intestinal obstruction” and “CT enterography finding of asymmetrical wall thickening” became significant in sensitivity analyses using only the studies with low bias. ASCA, anti-Saccharomyces cerevisiae antibody; CT, computed tomography; IC, ileocecal valve; IGRA, interferon-γ-releasing assay.

