
Figure 3. Annualized rates of parapneumonic empyema related hospitalizations per 100,000 children <18 years (95% CI) by likely causative organism, PCV period and age group, United States (1997–2013).
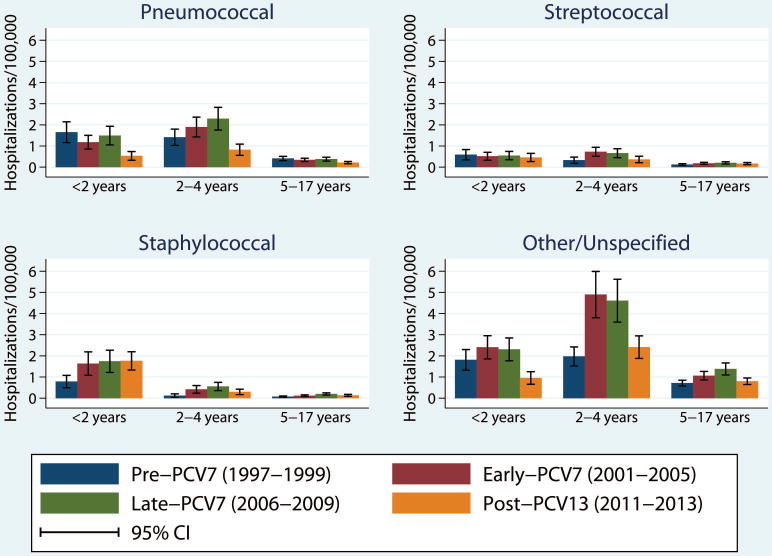
Legend: Annualized rates of hospitalization for parapneumonic empyema by organism type (pneumococcal, streptococcal, staphylococcal or other/unspecified), age group and period, per 100,000 children. Error bars represent the 95% confidence interval of the rate of hospitalizations for parapneumonic empyema by age group and period within each organism type.