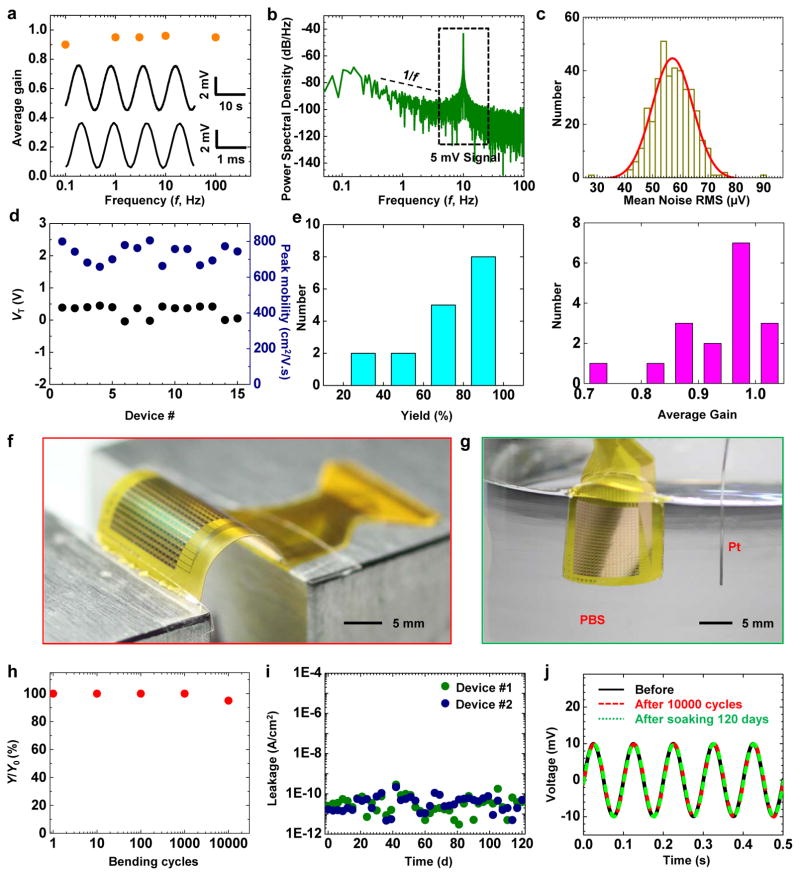
Figure 2.
In vitro assessment of electrical performance. (a) Average gain of a representative capacitively coupled transistor as a function of the input frequency (f) from 0.1 to 100 Hz. Inset shows the responses from this sensor node at 0.1 Hz (top) and 100 Hz (bottom), after band-pass filtering (0.05–568 Hz). (b) Power spectral density of a 5 mV AC signal at 10 Hz measured at a representative node, showing a typical 1/f relationship at low frequency. The input was a sine-wave of 5 mV at 10 Hz. (c) Histograms of noise (with Gaussian fitting) measured from all 396 nodes of the device in Fig. 1c. (d) Statistics of the threshold voltage (VT) and peak effective mobility (μeff) of test transistors from 15 different arrays. (e) Statistics of yield (left) and gain (right) of 17 capacitively coupled, active sensing 18×22 electrode array. (f) Image of a device during a mechanical bending test. (g) Image of a device completely immersed in a saline solution, during a soak test. (h) Yield (Y, defined as the number of working nodes divided by the total number of nodes) as a function of cycles of bending to 5 mm bend radius, showing minimal changes up to 10000 cycles. (i) Electrical leakage current of 2 devices during soak testing. Minimal leakage appears over a period of 120 days at 37 °C. (j) Response of a representative node to a sine wave input (at 10 Hz) before, after 10000 cycles bending, and after saline immersion for 120 days.

