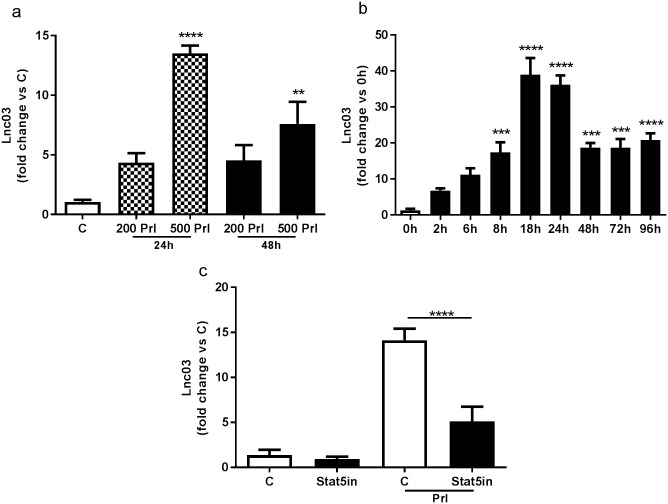
Fig 5. Analysis of Lnc03 expression in MIN6 cells.
a) MIN6 cells were treated with 200 or 500ng/ml Prl (200 Prl, 500 Prl) for 24h (grey bars) and 48h (black bars), non-treated cells were used as control (C, white bar). Total RNA was used to perform RT-qPCR. Data are presented as fold change versus C, mean±SEM, n = 3. b) Lnc03 expression was evaluated in a time course experiments in MIN6 cell treated with 500ng/ml Prl (black bars). 0h (white bar) represents non-treated control cells. Data are presented as fold change versus 0h, mean±SEM, n = 4. c) MIN6 cells were treated with 100μm Stat5 inhibitor alone (Sta5in) or together with 500ng/ml Prl (Sta5in+Prl) or Prl alone for 24h. Control cells were not treated (C white bar). Data are presented as fold change versus C, mean±SEM, n = 4–8.

