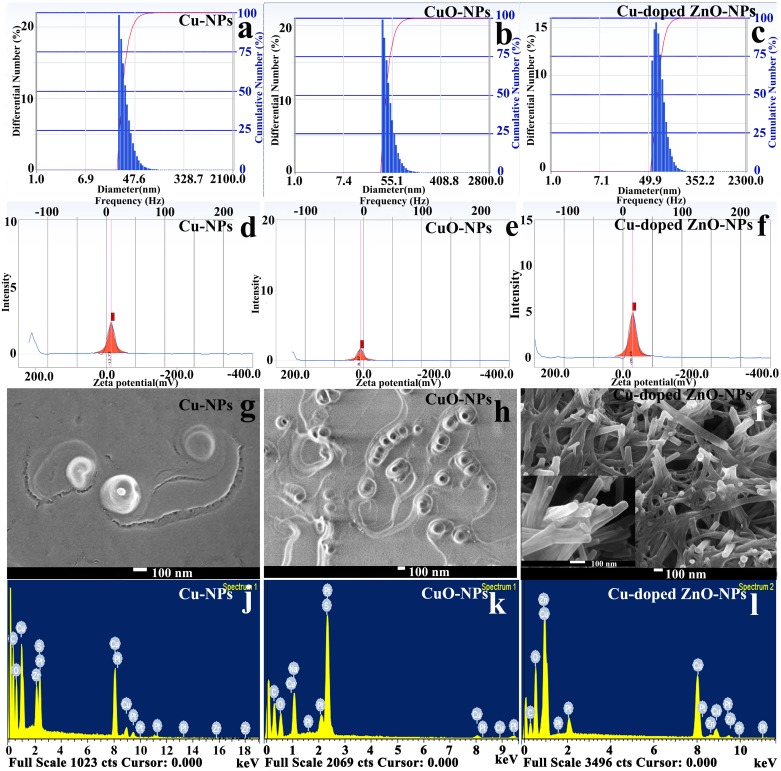
Fig 2. Characterization of NPs.
Bar histograms documenting particle distribution under DLS (a–e), intensity plots exhibiting surface electric charge potential under Zeta potential analyzer (d–f), FESEM image showing surface morphology and shape of individual nanocrystal (g–i), EDX plot demonstrating elemental nature of nanocrystals (j–l).

