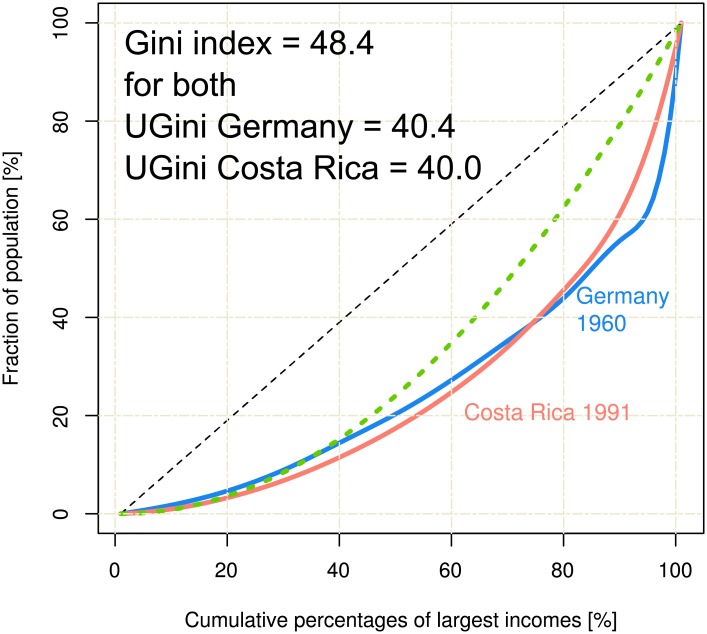
Fig 3. Lorenz curves describing different inequalities while delivering the same Gini index.
Up to about 70% of the population the Lorenz curve indicated for Germany in 1960 a more inequal income distribution than for Costa Rica in year 1991. However, both curves possess the same Gini index of 48.4%. This illustrates the ambiguity from which the Gini index suffers. For comparison, the Lorenz curves of the uniform and identity distributions are displayed as green and black dashed lines, respectively. By contrast, the proposed UGini indices are UGini = 40.4 for Germany, and UGini = 40.0 for Costa Rica, hence, the ambiguity was solved in the novel index. The Fig has been created using the R software package (version 3.4.0 for Linux; http://CRAN.R-project.org/ [18]).

