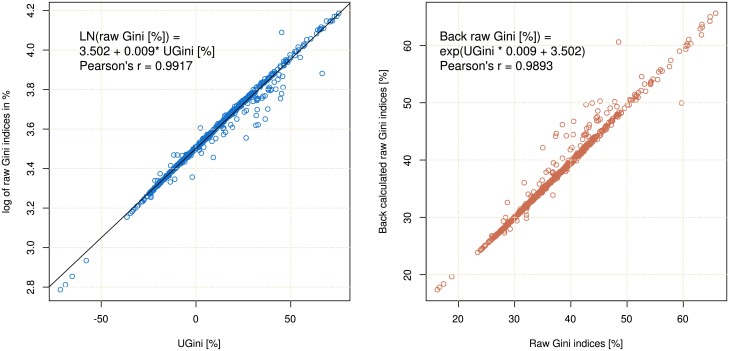
Fig 4. Correlation dot plots between different variants of the Gini index analyzed in this paper.
Left: Correlation between the unambiguous standardized Gini index obtained as , where Su = 0.6091 denotes the standard deviation of the log-normal distribution with Gini index Gu. and the log of the raw Gini indices. Right: Agreement of the original raw Gini index and the Gini index resulting from back transformation of the UGini parameter. The Fig has been created using the R software package (version 3.4.0 for Linux; http://CRAN.R-project.org/ [18]).

