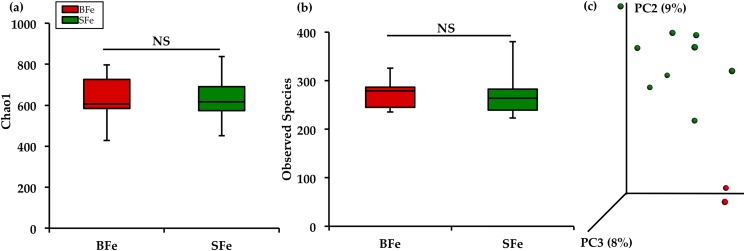
Fig 2. Microbial diversity of the cecal microbiome.
(a) Measures of α-diversity using the Chao1 Index; (b) Total number of observed species; (c) Measure of β-diversity using unweighted UniFrac distances separated by the first three principal components (PC). Each dot represents one animal, and the colors represent the different treatment groups.

