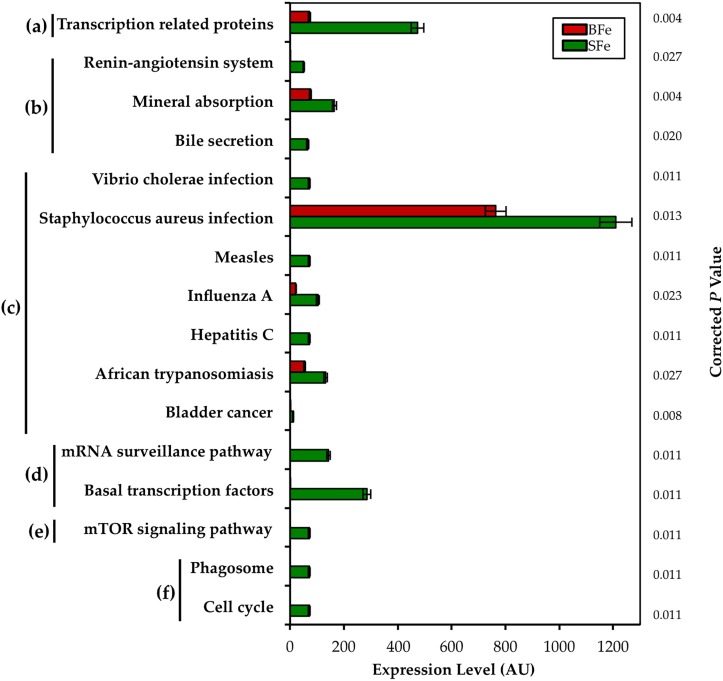
Fig 5. Observed alterations in the metabolic capacity of the cecal microbiota in the BFe group compared to the SFe group.
Relative abundance of differentially–enriched KEGG microbial metabolic pathways in cecal microbiota, including a) Unclassified; b) Organismal Systems; c) Human Diseases; d) Genetic Information Processing; e) Environmental Information Processing; and f) Cellular Processes. Treatment groups are indicated by the different colors, and FDR-corrected P values are displayed on the y-axis.

