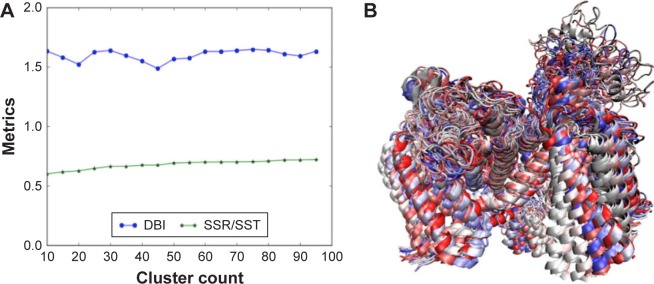
Figure 10.
The RMSD clustering for binding-site residues of the hNav1.5 model over the 580 MD production simulations. (A) The DBI over the SSR/SST metrices plot is shown, in which the clustering converges at 20 dominant PDB conformations; (B) the superimposed structures of the 20 dominant PDB conformations, selected through the RMSD clustering of binding-site residues of the hNav1.5 MD trajectory, are also provided.
Abbreviations: DBI, Davies–Bouldin index; RMSD, root-mean square deviation; SSR, sum of squares regression; SST, total sum of squares.

