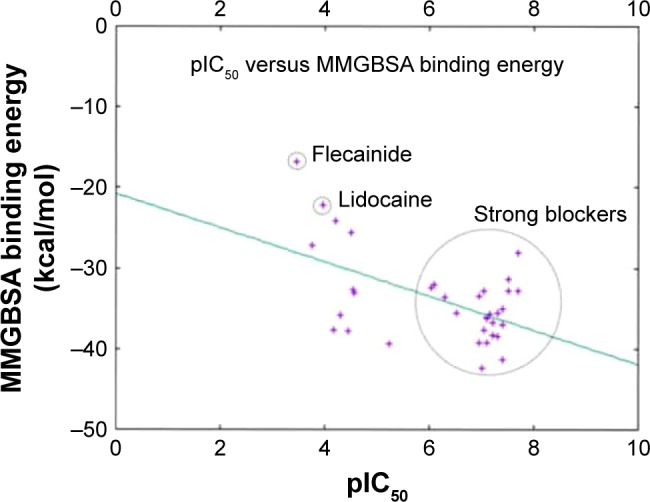
Figure 11.

A 2D scatter plot comparing the calculated AMBER-MMGBSA binding free energies against the in vitro measured pIC50 data from CHEMBL. Data points were fitted using gnuplot according to the model: f(x) = ax + b; where a is given by −2.12 and b is given by −20.74. The point represents flecainide (weakest blocker); lidocaine and the strong blockers regions are circled.
