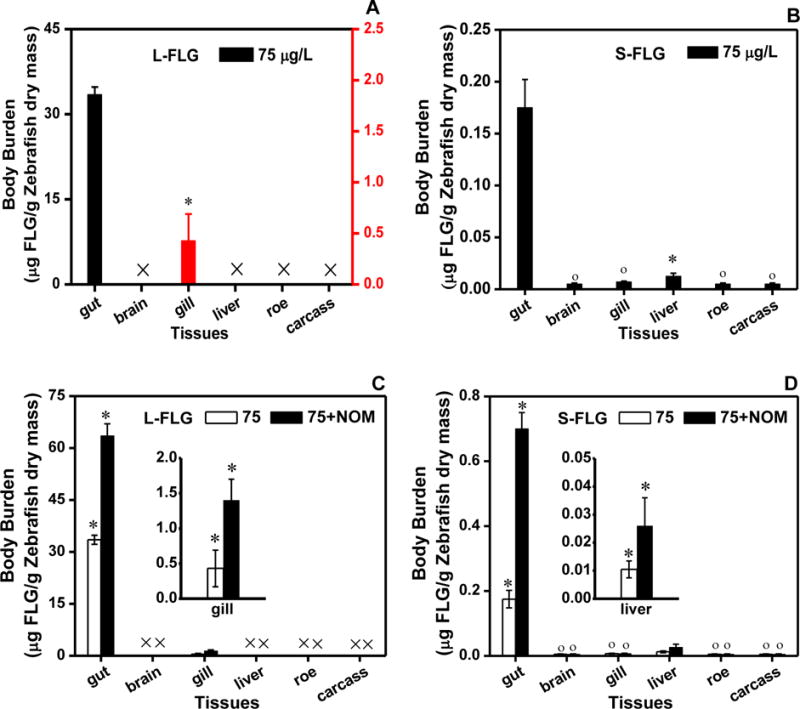
Figure 4.

Distribution of L-FLG and S-FLG with the absence (A, B) or presence (C, D) of NOM in zebrafish. The left ordinate in Figure 4A is for gut while the right one is for the gill. Zebrafish were exposed to graphene in freshwater for 48 h with the absence or presence 10 mg (TOC)/L NOM and an initial suspended graphene concentration of 75 μg/L. Mean and standard deviation values were calculated from five samples; Tukey’s multiple comparisons test, p ≥ 0.05. The symbols (°) and (*) indicate not significantly or significantly different from zero, respectively.
