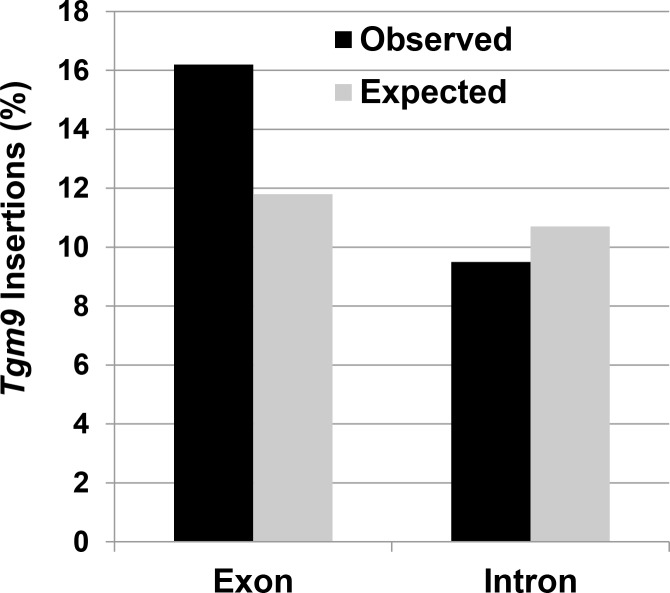
Fig 3. Percent distribution of the type of Tgm9-induced mutants.
The observed frequency of Tgm9 insertions in exonic and intronic sequences were calculated from 105 Tgm9 insertion loci (S3 Table). The expected frequency of Tgm9 is based on random insertion of the element in the exonic and intronic sequences calculated from the soybean genome sequences mapped to chromosomes (Soybase). The χ2 value (1.7752 at df = 1) calculated for observed Tgm9 insertion frequencies and expected frequencies of random Tgm9 insertions in exon and intron sequences is statistically non-significant at p = 0.05.

