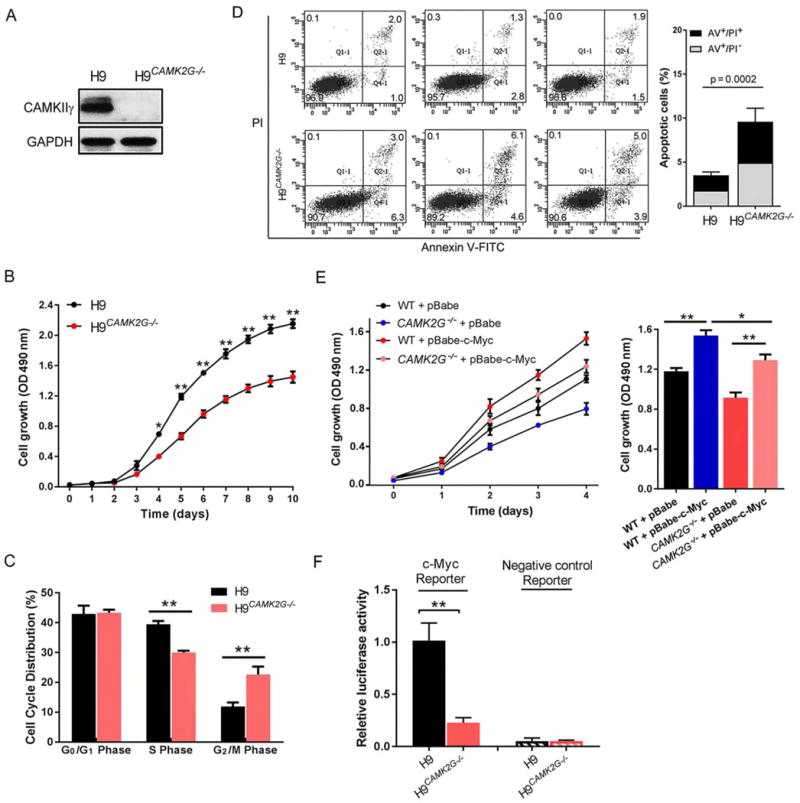
Figure 3. CAMKIIγ: c-Myc axis is essential for the proliferation of T cell lymphoma cells.

(A) Representative western blots of CAMKIIγ and GAPDH levels in H9 and H9CAMK2G−/− cell lines. GAPDH was used as a loading control.
(B) Proliferation curves of H9 and H9CAMK2G−/− cells. 1.5 × 10³ H9 or H9CAMK2G−/− cells were plated in normal growth medium in 96-well plates and MTS assays were performed for a total of 10 days.
(C) Propidium iodide (PI) profiling of H9 and H9CAMK2G−/− cells shows the average percentage of cells in each phase of the cell cycle.
(D) The apoptosis rate in H9 and H9CAMK2G−/− cells was detected using flow cytometry for 3 independent experiments (left). Both early [Annexin V-FITC (AV)+/propidium iodide (PI)−] and late (AV/PI) apoptotic cells were calculated as the incidence of apoptotic cell death (right).
(E) H9 and H9CAMK2G−/− cells were infected with indicated retrovirus. 3 × 10³ transfected cells were plated in normal growth medium in 96-well plates and MTS assays were performed for a total of 4 days.
(F) C-Myc transcriptional activity was analyzed by luciferase assay. C-Myc reporter: pBV-Luc wt MBS1-4 plasmids; Negative control reporter: pBV-Luc.
Data represent the mean ± s.d. for three independent experiments. *p < 0.05, **p < 0.01. See also Figure S3.
