
Figure 5. CAMKIIγ stabilizes c-Myc by enhancing c-Myc phosphorylation at serine 62.
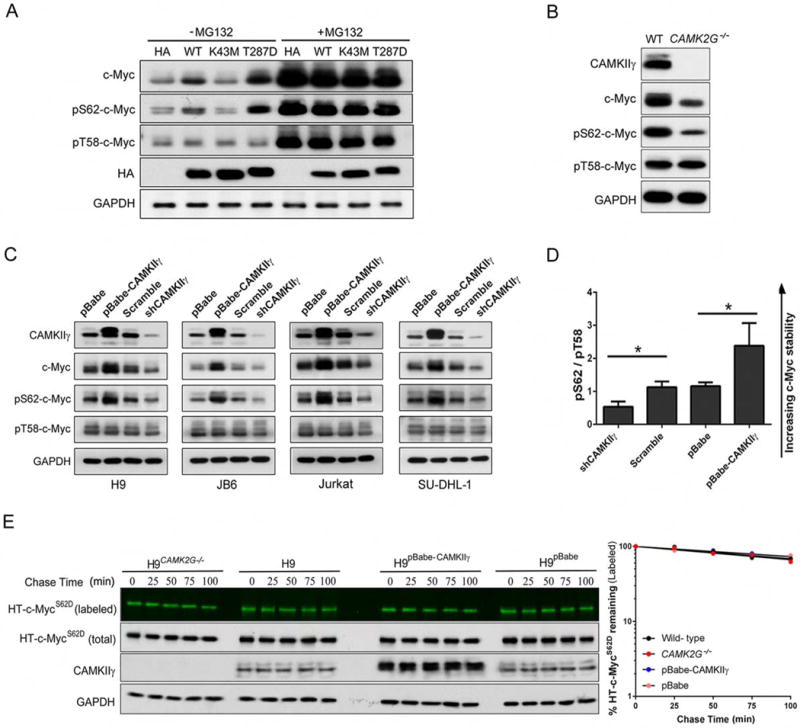
(A) The transfected H9CAMK2G−/− cell lines were treated with or without 10 μM of MG132 for 3 hr; whole cell lysates were analyzed by western blotting for indicated proteins. GAPDH and HA were used as controls.
(B) The c-Myc, p-c-Myc (S62 or T58), CAMKIIγ and GAPDH protein levels in whole cell lysates from H9 and H9CAMK2G−/− cells. GAPDH was used as a loading control.
(C) The c-Myc, p-c-Myc (S62 or T58), CAMKIIγ and GAPDH protein levels in whole cell lysates from indicated cell lines with knockdown or overexpression of CAMKIIγ. GAPDH was used as a loading control.
(D) The p-c-Myc (S62)/p-c-Myc (T58) protein levels (pS62/pT58) in Figure 5C were quantified after normalization to GAPDH. Data represent the mean ± s.d. for indicated cell lines. *p < 0.05.
(E) Pulse-chase analysis of c-MycS62D using HT-TMR system in indicated cell lines transfected with HT-c-MycS62D. The HT-TMR ligand-labeled HT-c-MycS62D was visualized with a fluoro- image analyzer (the top sub-panels) and the total expression of HT-c-MycS62D was analyzed by western blotting with GAPDH as loading control (left). The relative amount of HT-TMR ligandlabeled HT-c-MycS62D was measured with the densitometric intensity of each band (right). Best- fit exponential lines are shown for each cell line. Pulse-chase results shown here were representative of three independent experiments.
See also Figure S5.