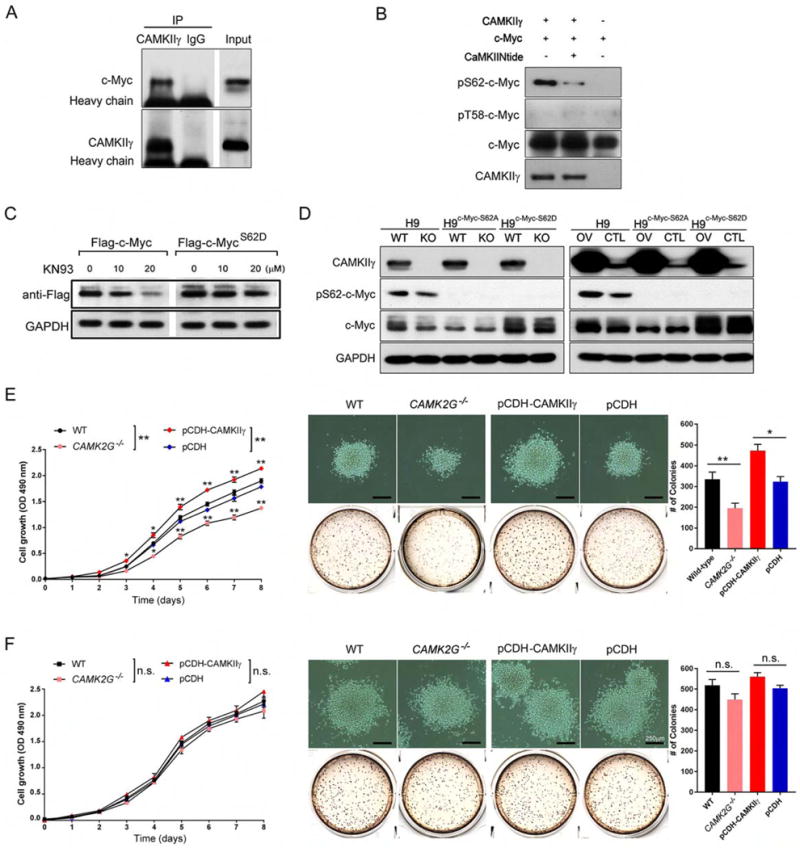
Figure 6. CAMKIIγ directly phosphorylates c-Myc in T cell lymphoma.

(A) H9 cell lysates were immunoprecipitated with control IgG or a CAMKIIγ antibody, and the immunoprecipitates were then analyzed by western blot analysis with a c-Myc antibody.
(B) After an in vitro CAMKIIγ kinase assay, p-c-Myc (S62) levels were analyzed using western blot analysis.
(C) H9 cells transiently transfected with the indicated vectors were treated with KN93 at the indicated concentrations for 24 hr. FLAG tagged protein expressions were analyzed by western blot analysis. GAPDH was used as a loading control.
(D) Western blot analysis of indicated proteins in the indicated stable TCL cell lines.
(E) Proliferation curve (left), representative images and quantification of the colonies (right) of the indicated H9 stable cell lines at Day 14.
(F) Proliferation curve (left), representative images and quantification of the colonies (right) of the indicated H9c-Myc-S62D stable cell lines at Day 14.
Data represent the mean ± s.d. for three independent experiments. n.s., not significant, *p < 0.05, **p < 0.01. Scale bars, 250 μm. See also Figure S6.
