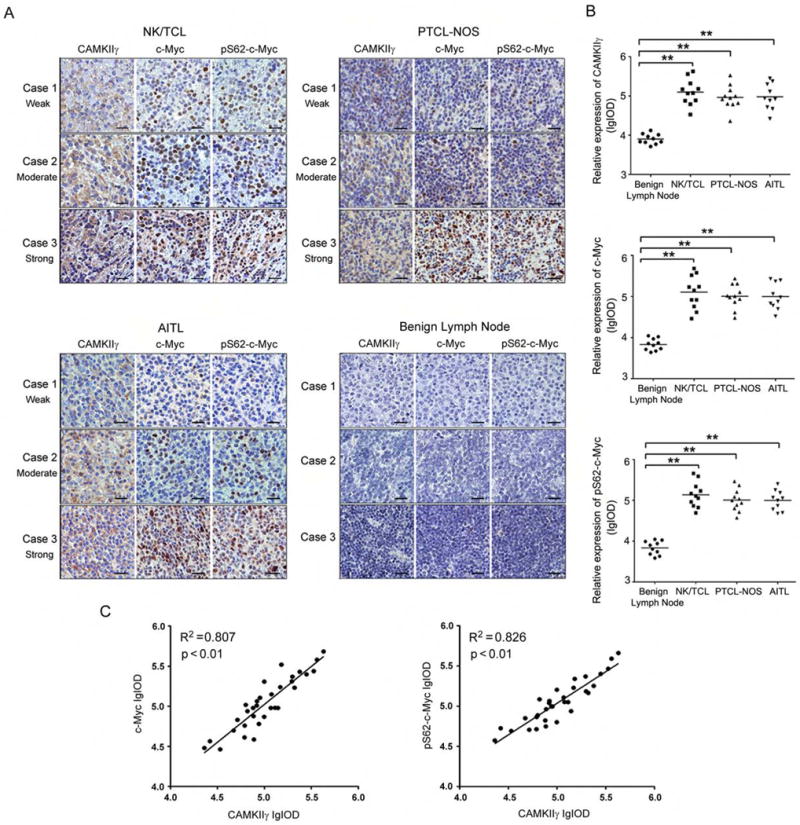
Figure 8. Positive correlations of protein expression among CAMKIIγ, c-Myc and pS62-c-Myc in human T cell lymphoma tissues.

(A) Representative images of IHC staining of CAMKIIγ, c-Myc, and pS62-c-Myc in human TCL tissues and benign lymph node tissues. Three representative TCL sections from 3 individual cases were compared for weak (Case 1), moderate (Case 2), strong (Case 3) for each subtype. Three representative benign lymph node tissue sections from 3 individual cases were used as control. Scale bars, 20 μm.
(B) Protein expressions in (A) assessed as lg (Common logarithm: base 10) integrated optical density (IOD) scores. **p < 0.01. The horizontal lines shown in graphs represented median of each protein expression.
(C) The correlation between CAMKIIγ, c-Myc, or pS62-c-Myc expression in human TCL (n = 32). Correlation is shown using R2 and significance was determined using a Spearman correlation.
