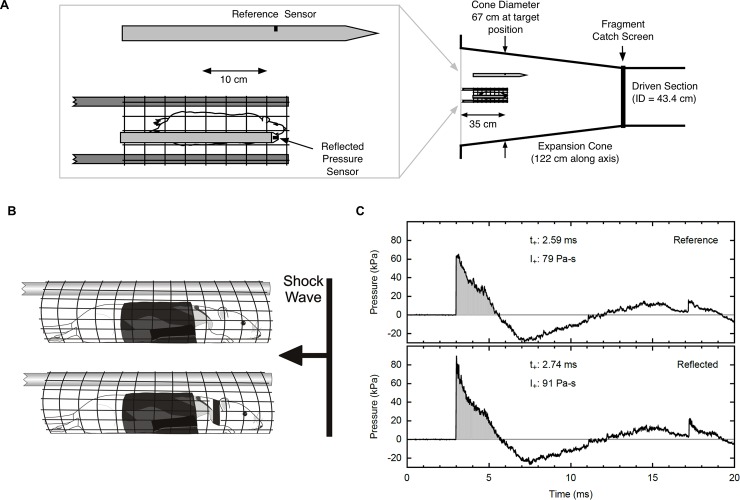
Fig 1. Blast exposure experimental design.
(A) Top view of animal in expansion cone of shock tube with positions of reference and reflected sensors indicated. Diagram illustrates length of driven section and expansion cone of shock tube and cone diameter at target position. (B) Side view of animal with Kevlar vest in mesh holder. Top diagram illustrates unrestrained animal group and bottom diagram illustrates restrained animal group. (C) Representative shock wave produced by the USAISR shock tube as measured by the reflected pressure and overpressure sensors. Pressure represented in kilopascal (kPa). (t+ = time; duration of peak, I+ = impulse; area under peak).

