
Fig. 2.
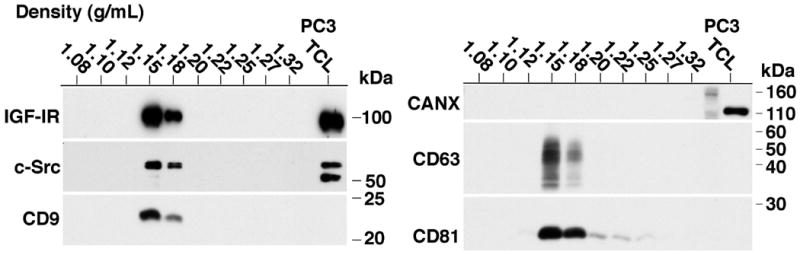
Sucrose gradient analysis and exosomal expression of c-Src and IGF-IR in PC3-derived exosomes. 80 μg PC3 Exo were used as input material. IB analysis for CD63, CD81, CANX, IGF-IR, and c-Src of each density fraction is shown. Results shown in the left and right panels are from two gels run in reducing and non-reducing conditions, respectively. The rightmost lane of each gel shows 10 μg of PC3 TCL used as a positive control. N=3; a representative image is shown.