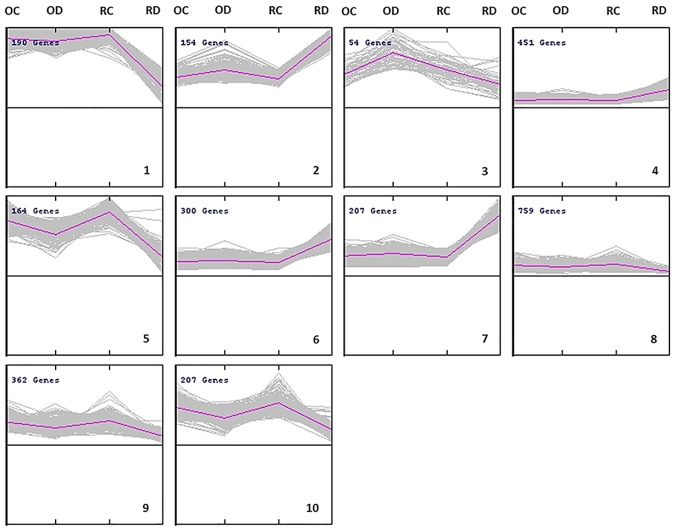
Fig 3. K-means clustering of the differentially expressed gene (FDR< 0.05 and |log2 Ratio| > 1).
In each box, grey lines represent genes, whose expression level vary in the four experimental conditions namely, ‘Ortice’ undamaged (OC), ‘Ortice’ damaged (OD), ‘Ruveia’ undamaged (RC) and ‘Ruveia’ damaged (RD). A pink line represents the average expression profile of all genes in each cluster. In the top-left corner, it is reported the total number of genes in the cluster. A progressive cluster (K) number is indicated in the bottom-right corner.

