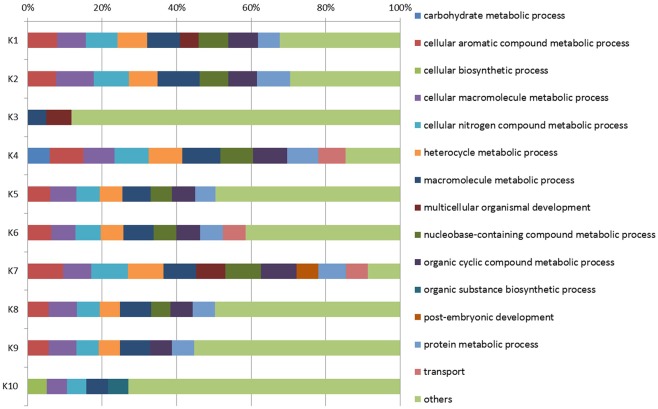
Fig 4. Functional categories of the clusters of the DEGs (FDR< 0.05 and |log2 Ratio| > 1).
Each horizontal bar refers to the clusters (numbered from K1 to K10; see Fig 3) deriving from K-means clustering. Bars are partitioned into colored segments whose length represents the relative number of sequences for each GO term (level 4; BP; sequence cut-off: 5%).

