. 2017 Jun 26;6:e28533. doi: 10.7554/eLife.28533

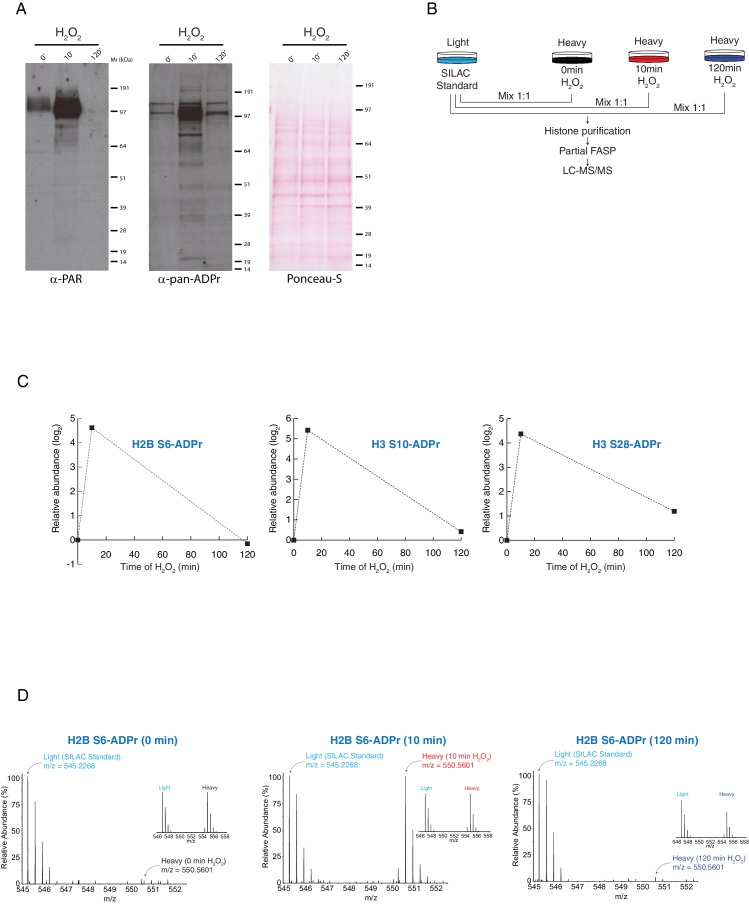
Figure 1. Histone serine ADP-ribose modification is reversible.

U2OS cells were treated with H2O2 and analysed at indicated time-points. (A) The samples were lysed and the proteins were separated by SDS-PAGE, analysed by western blot and probed for PAR (left) or pan-ADPr (middle). Ponceau-S staining was used as loading control (right). (B) Schematic representation of the SILAC-based strategy to quantify core histone Ser-ADPr marks after different time points of 2 mM H2O2–induced DNA damage. Light labeled (Lys0) cells treated for 10 min with 2 mM H2O2 were used as SILAC Standard. (C) The relative abundance of Ser-ADPr modification on histone proteins H2B (Ser6) and H3 (Ser10, Ser28) was calculated and plotted as a function against time of H2O2 treatment. (D) MS1s of a Ser-ADPr H2B peptide (H2B Ser6-ADPr) at different time points of 2 mM H2O2 treatment. The heavy peptide was derived from cells treated with H2O2 for the indicated time point, and the light peptide was derived from the SILAC Standard (10 min H2O2-treated cells). Each inset (right) shows a ∼1:1 ratio (heavy/light) of a non-ADP-ribosylated peptide from the same experiment.

DOI: http://dx.doi.org/10.7554/eLife.28533.003

Figure 1—source data 1. MaxQuant evidence table related to Figure 1—figure supplement 1.
ADPr identified peptide features from SILAC experiments performed to quantify ADPr after different time points of 2 mM H2O2–induced DNA damage (Figure 1—figure supplement 1).
DOI: 10.7554/eLife.28533.004

Figure 1.

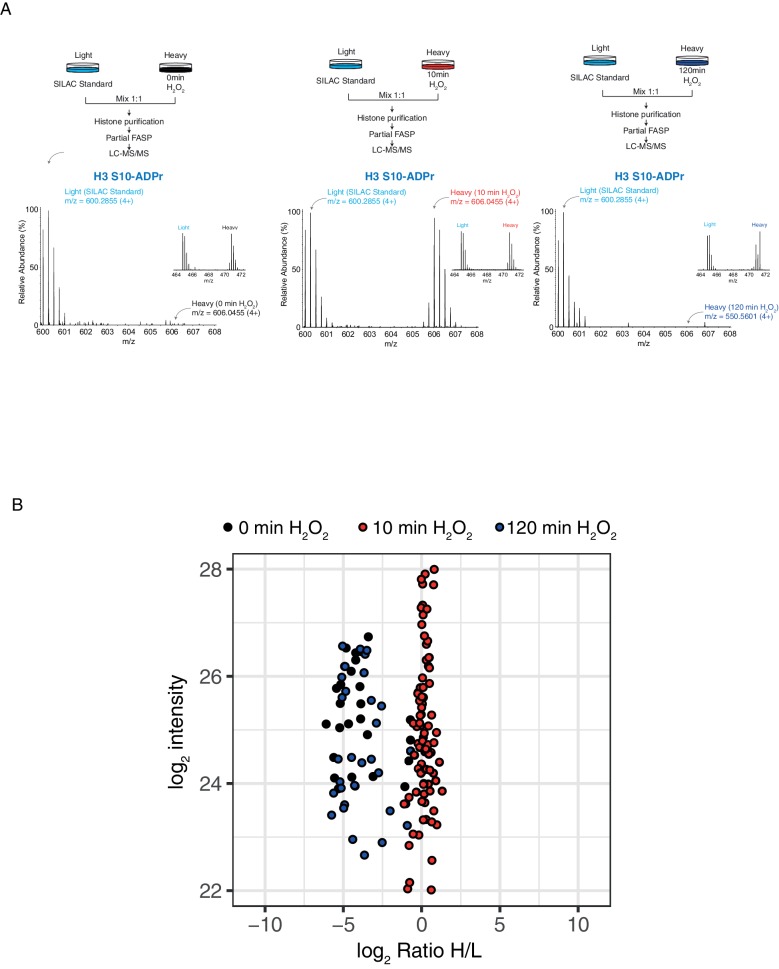
Figure 1—figure supplement 1. Histone serine ADP-ribose modification is reversible.

Figure 1—figure supplement 1.

(A) Schematic representation of the SILAC-based strategy to quantify core histone Ser-ADPr marks after different time points of 2 mM H2O2–induced DNA damage. Light labeled (Lys0) cells treated for 10 min with H2O2 were used as SILAC Standard (top panels). MS1s of a Ser-ADPr H3 peptide (H3-Ser10-ADPr) at different time points of 2 mM H2O2 treatment (bottom panels). The heavy peptide was derived from cells treated with H2O2 for the indicated time point, and the light peptide was derived from the SILAC Standard (10 min H2O2-treated cells). Each inset (right) shows a ∼1:1 ratio (heavy/light) of a non-ADP-ribosylated peptide from the same experiment. (B) Log2 of summed ADPr peptide intensities were plotted against log2 of ADPr Heavy/Light SILAC ratios for each time point. ADPr peptides detected after 0 min of 2 mM H2O2 are colored in black. ADPr peptides detected after 10 min 2 mM H2O2 are colored in red. ADPr peptides detected after 120 min 2 mM H2O2 are colored in blue.