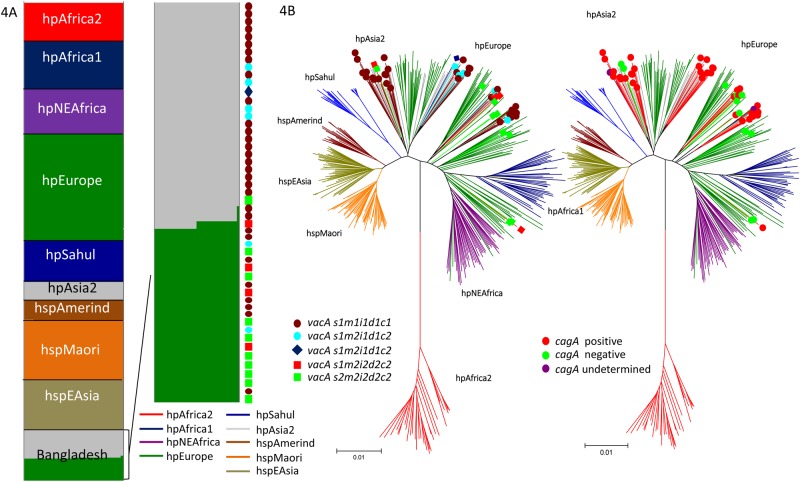
Fig 4. Population analysis of Bangladeshi strains.
The number of tentative populations (K) was set from 7 to 15, and 5 to 15 runs were executed for each of the K population components, which are represented in K colors. Each vertical line in the bar chart represents a single strain, and the line colors indicate the population to which each strain might belong. The lengths of the colored lines are proportional to the probability that the strain belongs to that particular population. The population segregated into two populations, hpAsia2 and hpEurope, as confirmed by non-admixture STRUCTURE analysis (4A). We used a different line color to distinguish each population type in both STRUCTURE and in the neighbor-joining tree constructed in 4B (e.g., hpEurope is shown in green, and hpAsia2 is shown in grey). The position of strains in relation to their genotypes are shown in colored boxes or circles.

