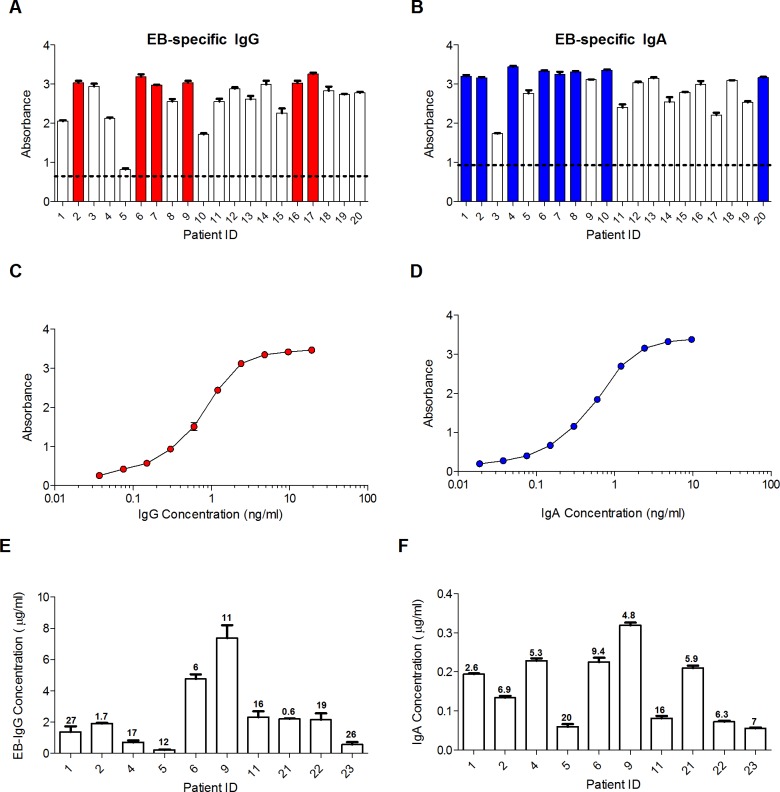
Fig 3. Creation of EB IgG and IgA standards for antibody quantitation.
Sera from 20 CT-infected women were screened at a 1/1,000 dilution for (A) IgG antibodies and at a 1/50 dilution for (B) IgA antibodies that bound to pooled EBs. Shown is the mean absorbance ± SD for duplicate samples. The colored columns indicate sera that were subsequently pooled for use as the EB IgG or IgA standard and calibrated relative to total IgG and IgA standards, as described in the Methods. The dashed line represents the mean absorbance + 3 SD obtained with negative control IgG proteins at 10–20 μg/ml or IgA proteins at 20–40 μg/ml, concentrations approximately equivalent to those that would be present in serum diluted 1/1,000 (for IgG) or 1/50 (for IgA). (C) The EB IgG standard curve obtained after pooling the indicated sera is shown as mean ± SD for duplicate 2-fold serial dilutions, starting at a 1/1,000 dilution and a concentration of 19 ng/ml. (D) The EB IgA standard curve is similarly shown as mean ± SD for duplicate 2-fold dilutions starting at a 1/50 dilution and a concentration of 9.6 ng/ml. Using the EB IgG and IgA standards, (E) anti-EB IgG and (F) anti-EB IgA antibodies were measured in serum from 10 CT-infected women. Shown is the mean concentration ± SD obtained in two separate experiments. The inter-assay deviation for each sample is shown as the % CV (100% x SD/mean) above each column.

