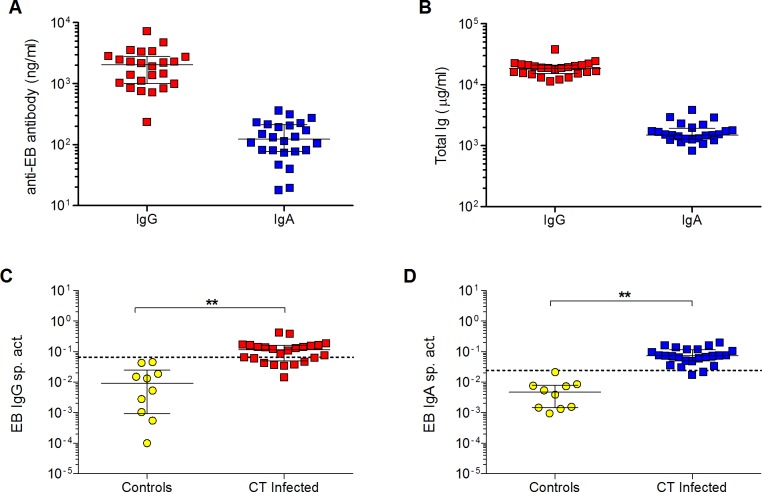
Fig 4. Quantification of EB-specific IgG and IgA in serum of CT-infected women.
(A) Concentrations of anti-EB IgG or IgA antibodies were measured in serum from 24 CT-infected women using the EB IgG or IgA standard. (B) Concentrations of total IgG and IgA in the sera were also measured by ELISA. The magnitude of systemic antibody responses to CT in infected women was determined by calculating the (C) EB IgG or (D) IgA specific activity (ng anti-EB IgG or IgA antibody per μg total IgG or IgA, respectively). The thresholds for significance in each assay are indicated by dashed lines representing the mean specific activity + 3 SD for negative controls (IgG or IgA myeloma proteins or human monoclonal antibodies to irrelevant antigens). Bars in all graphs denote medians and interquartile ranges. The EB specific activity in CT-infected women and controls was compared using the two-tailed Mann-Whitney rank sum test. **p < 0.01.

