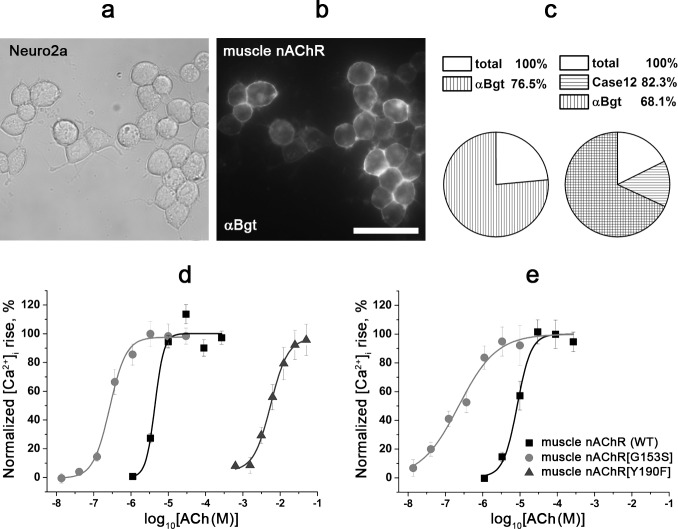
Fig 7. Cytochemistry and calcium imaging of Neuro2a cells expressing WT and G153S, Y190F mutant muscle nAChRs.
(a, b) Cytochemical labeling of WT muscle nAChR with Alexa Fluor 555-α-bungarotoxin (50 nM, αBgt) in Neuro2a cells. (a) Bright field image, (b) fluorescent image. Scale bar, 50 μm. (c) Pie charts represent percentage of transfected Neuro2a cells labeled with Alexa Fluor 555-α-bungarotoxin (αBgt) in the absence (n = 3, 413 total cells and 311 cells labeled with αBgt) or in the presence of Case12 (n = 3, 1233 total cells, 1005 cells expressing Case12, and 834 cells labeled with αBgt), respectively. (d, e) Dose-response curves of the [Ca2+]i rise amplitude in cells expressing WT and G153S, Y190F mutant muscle nAChRs in response to different concentrations of acetylcholine. The protein calcium sensor Case12 (d) and the fluorescent dye Fluo-4 (e) were used to register changes in [Ca2+]i. Each plot point reflects data obtained from 4 independent experiments (mean ± SEM).

