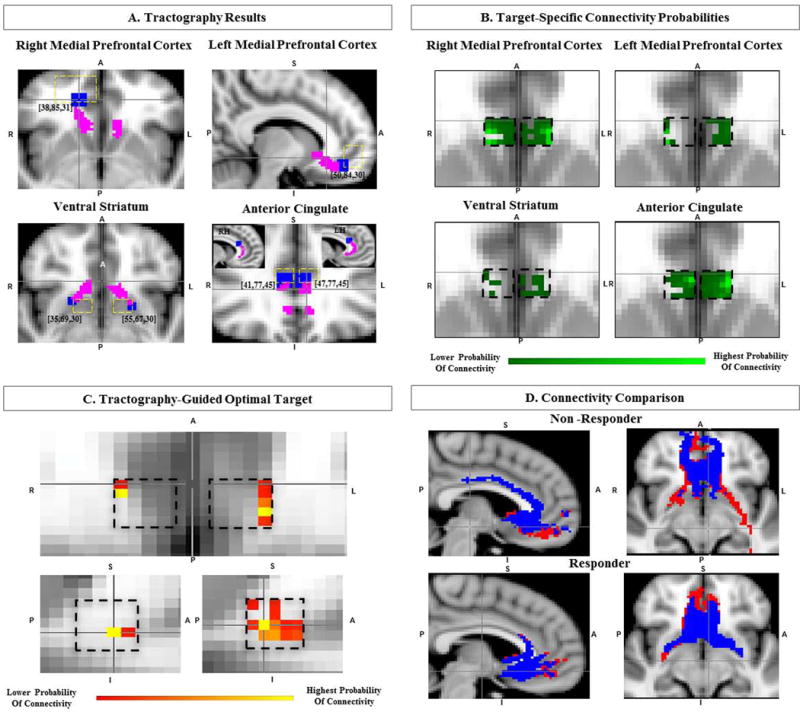
Figure 1.

Identifying the Connectivity-Guided Optimal Target within the Subcallosal Cingulate cortex (SCC) A. Single-subject structural connectivity (magenta) of SCC to 4 distinct subject specific target regions (blue), as labeled, with coordinates on MNI152 template (predefined ROI areas with yellow dashed lines). B. Single-subject tomographic target-specific probabilistic connectivity maps of SCC. C. Single-subject tractography-guided optimal target (TOT) within SCC (black dashed lines), identifying the region with highest joint probability of connectivity with all targets. D. Connectivity comparison of TOT (red) versus volume of activated tissue (blue) in both responder and non-responder, activated tissue connectivity with ventral striatum in the non-responder. A=anterior, P=posterior, R=right, L=left, S=superior, I=inferior, RH=Right Hemisphere, LH=Left Hemisphere.
