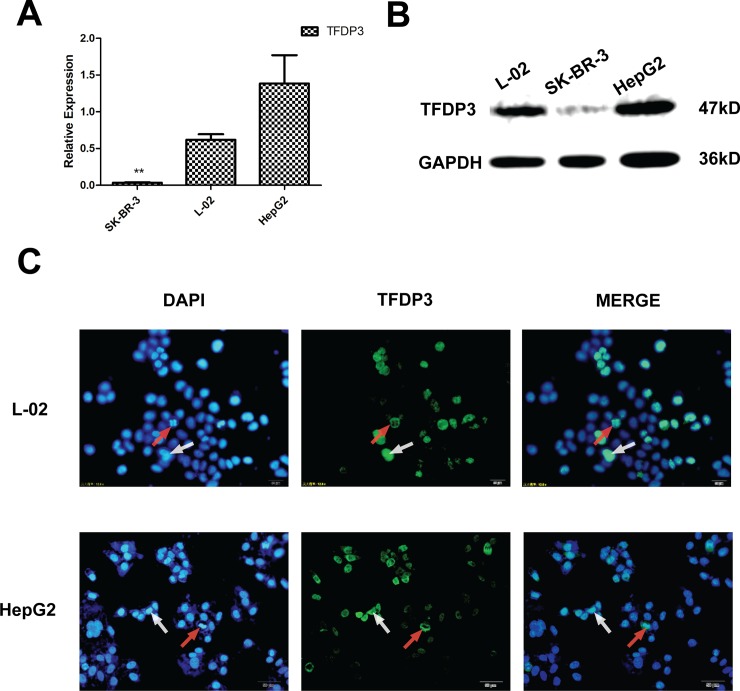
Fig 2. Expression of TFDP3 on L-02 cells and HepG2 cells.
(A) The expression of TFDP3 in SK-BR-3, L-02 and HepG2 cell lines in mRNA level was detected by quantitative RT-PCR. TFDP3 and GAPDH primer sequences were shown before. L-02 and HepG2 cell lines expressed TFDP3 at the RNA level, and the expression level of TFDP3 in L-02 cell line was lower than in HepG2 cell line. The expression of TFDP3 in SK-BR-3 cell line was negative. (B) The expression of TFDP3 in SK-BR-3 cells, L-02 cells and HepG2 cells detected by Western Blot, and the expression level of TFDP3 in L-02 cell line was lower than in HepG2 cell line. (C) Immunofluorescence staining was used to detect the localization and expression of TFDP3 in L-02 cells and HepG2 cells. TFDP3 molecules could locate only in cytoplasm (as in the cells in mitotic indicated by red arrow), or also locate in the nucleus (as in indicated by white arrow).

