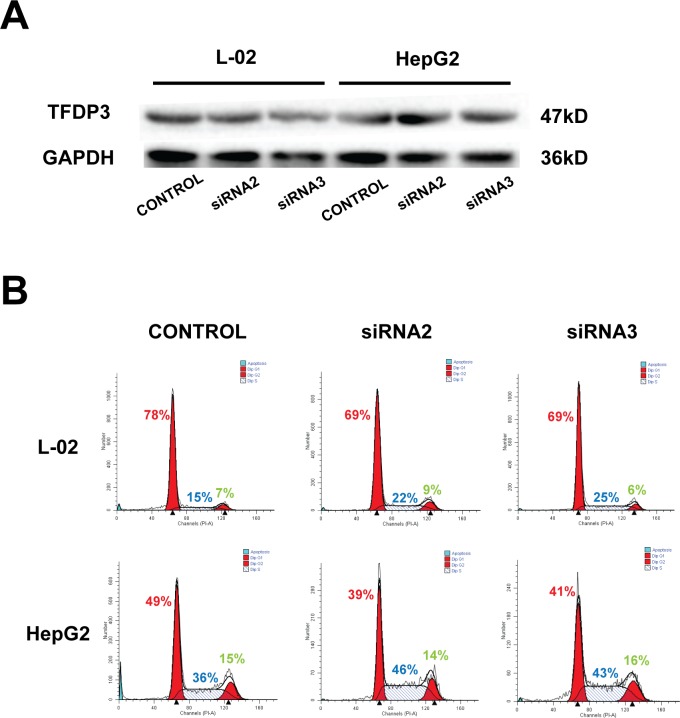
Fig 4. Cell cycle changes of L-02 cell line and HepG2 cell line after TFDP3 knockdown.
(A) The expression of TFDP3 in L-02 and HepG2 cell lines transfected with TFDP3-siRNA2 and TFDP3-siRNA3 was detected by Western Blot. (B) Flow cytometry was used to detect cell cycle changes in L-02 and HepG2 cell lines after TFDP3 knockdown (Red number = G1 phase, Blue number = S phase, Green number = G2 phase). It is clearly that the proportion of cells in G1 phase declined, and inclined in S phase.

