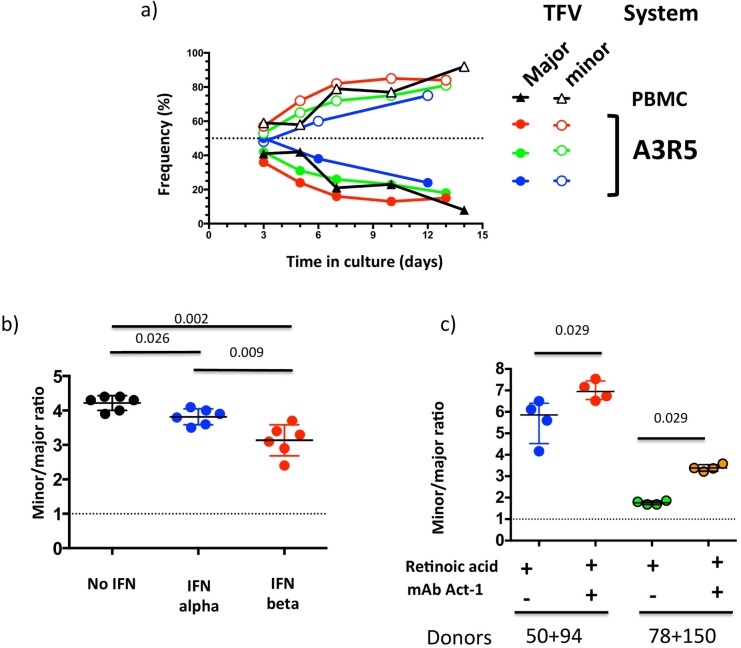
Fig 4. 40100 major and minor T/F viruses present distinct phenotypes in in vitro competition assays.
a) The replication capacity of FLIMCs from 40100 major and minor T/F viruses was compared. Lines represent the proportion of infected cells that carried each T/F virus. Colors code for each experiment, which were conducted on PBMCs or the A3R5 cell line, as indicated. b) Ratio of cells infected with minor vs. major T/F virus after 6-day culture in PBMCs in control conditions (black), and in the presence of IFN alpha (blue) or IFN beta (red). c) Ratio of cells infected with minor vs. major T/F virus after 6-day culture in RA-treated PBMCs in the absence (blue, green) or presence (red, orange) of α4β7-blocking mAb Act-1. Data for two different PBMC donor pools, 50+94 and 78+150, are shown. In all the experiments, the initial inoculum was a 1:1 mixture of the two viruses (dotted lines). Whiskers represent interquartile intervals.

