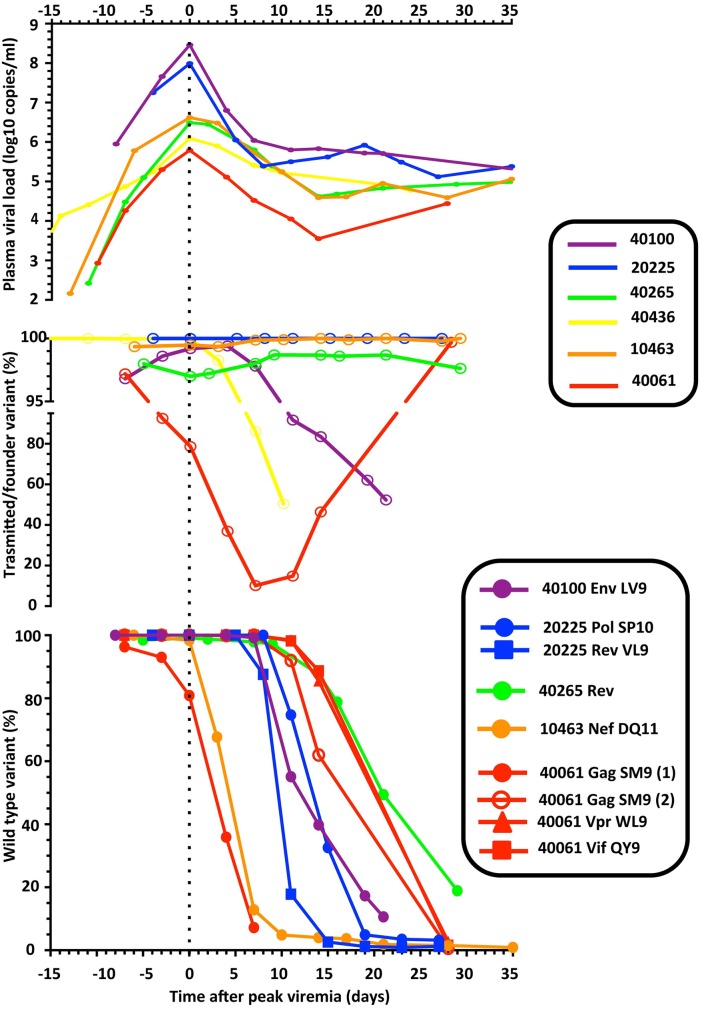
Fig 5. Summary of viral dynamics during AHI.
For the 6 participants considered in the current study, we compare the dynamics of pVL, of the frequency of the major T/F lineage, and of viral escape from CTL responses. For the sake of clarity, the curves were aligned based on day of peak viremia. For epitope Gag SM9 in participant 40061, the initial replacement of the major T/F by the minor T/F sequence is indicated separately from the later escape that proceeded through epitope shattering (1 and 2, respectively). For participant 40265, the CTL epitope in Rev has not been mapped.

