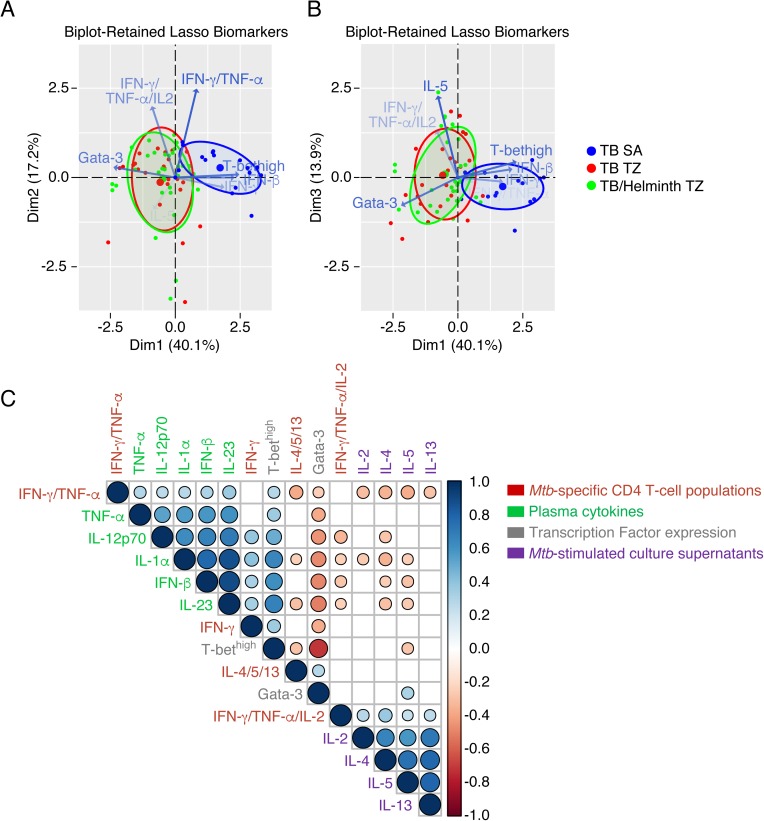
Fig 5. Th1 cytokine profiles are associated with elevated systemic inflammation markers.
Principal component analysis (PCA) of Mtb-specific immunity determined in TB patients from SA (n = 15), TB and Mtb/helminth co-infected patients from TZ (n = 25 and 30, respectively). Blue, red and green symbols represent TB patients from SA, TB patients from TZ, and Mtb/helminth co-infected patients, respectively. Blue, red and green ellipses represent clusters formed by 70% of TB patients from SA, TB patients and Mtb/helminth co-infected patients from TZ, respectively. Blue arrows represent the differentially expressed immune parameters that significantly contributed (P<0.05) to discriminate Mtb-specific immune signatures (A and B). (C) Correlogram of imputed Spearman-Rank-Correlation between the proportion of triple IFN-γ/TNF-α/IL-2, dual IFN-γ/TNF-α, single IFN-γ and single IL-4/5/13 Mtb-specific CD4 T cells among total Mtb-specific CD4 T-cell responses, levels of IL-2, IL-4, IL-5 and IL-13 detected in Mtb-stimulated culture supernatants, percentages of memory CD4 T cells expressing Gata-3 or T-bethigh, serum levels of IL-1α, TNF-α, IL-12p70, IFN-β and IL-23 determined in TB patients from SA and TZ (n = 70). Statistical significance was calculated using non parametric test. Empty squares correspond to non significant correlations (P>0.05), blue circles indicate direct correlations and red circles indicate inverse correlations (P<0.05). Blue and red circle sizes indicate statistical amplitude of correlation.

