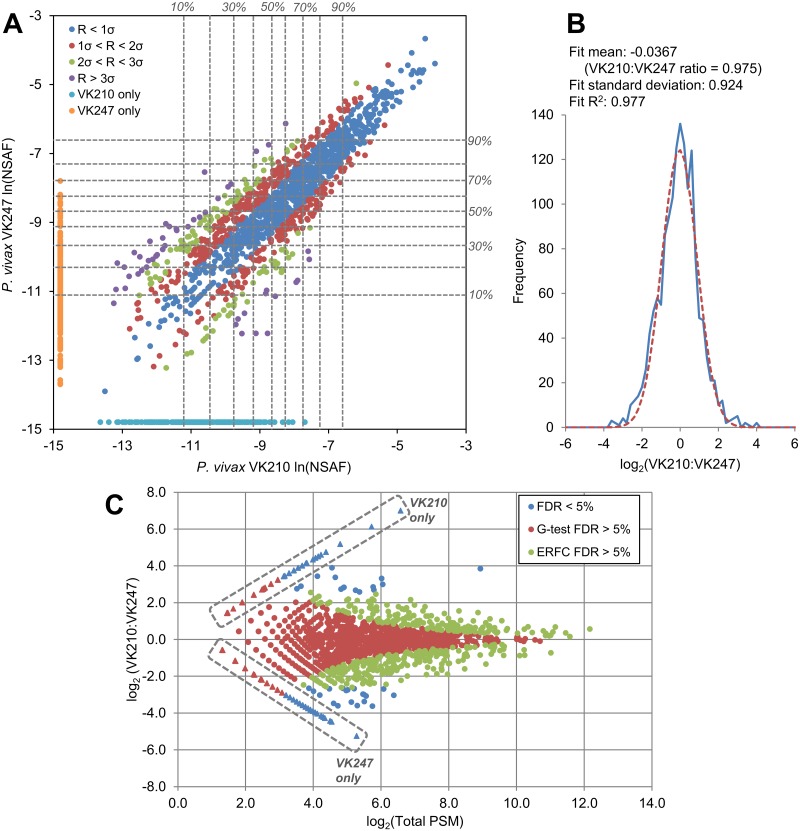
Fig 1. Quantitative comparison of protein expression between two P. vivax salivary gland sporozoite field isolates.
(A) Protein abundances based on spectral counts were estimated using the normalized spectral abundance factor (NSAF). Each point represents the natural log-transformed NSAF value of a protein, comparing its ln(NSAF) value in either sample. Deciles of relative abundance within each sample are shown (dashed gray lines). For each protein observed in both of the two P. vivax salivary gland sporozoite samples, the natural log of the protein ratio of the NSAF values observed in the VK210 sample and the VK247 sample was calculated as ln(NASF)VK210-ln(NSAF)VK247. The population of these values produced a normal distribution centered near zero, corresponding to a mean ratio of 1:1 (S1 Fig). Proteins identified in both samples are color-coded to indicate the deviation of their log-transformed protein ratio R from the population mean as determined from the fit curve. Deviation from the mean was low at high abundances and increased with decreasing spectral counts. The cyan and orange points represent proteins identified in only one isolate or the other. (B) Protein ratios were calculated based on the adjusted and normalized spectral counts used to calculate the G statistic. The population of log-transformed protein ratios of proteins detected in both samples assumed a Gaussian distribution with a mean near zero. The mean and standard deviation from this distribution were used to calculate p-values using the complementary error function (ERFC). (C) The protein ratios of all proteins detected in either sample are plotted with respect to the sum of the adjusted and normalized PSM from both samples used to calculate the ratio for each protein. Points in red are proteins with that were not significant at a 5.0% false discovery rate (FDR) according to the G-test. Points in green are proteins with ratios that were not significant at a 5.0% FDR according to the ERFC. Points in blue are proteins ratios that were significant by both cut-offs. Points inside of dashed boxes represent proteins detected in only one sample or the other. Protein ratios were estimated for these proteins by increasing all spectral counts by one in order to give all proteins non-zero values.

